Inox Green Energy share analysis: Q1 FY27, valuation & outlook
Three large buy deals happened on Inox Green Energy share on 9 Oct 2026 and share price climbed up to 15% on same day and closed at 9.48% increase. Profit up 82% in Q1 FY27. Stock locked at lower circuit. Both happened to Inox Green within weeks, and the gap between them is the story. This Inox Green Energy share analysis asks one uncomfortable question: did Inox Green Energy Services Ltd (NSE: INOXGREEN) earn its profits from fixing turbines, or from marking up fund units? The answer is surprising, and so is the twist. A ₹550 crore deal closed on 7 October 2026 could nearly triple its O&M base within two quarters. At ₹125.99, the stock sits 55% below its 52-week high and 24% below what institutions paid just weeks ago. Value trap, or the last cheap entry before the numbers change? The data below will help you decide.
- Q1 FY27 (Apr–Jun 2026) PAT rose 82% YoY to ₹40.8 crore, yet revenue from operations fell 17% to ₹43.3 crore and core O&M EBITDA was about –₹0.9 crore.
- In FY26, ₹121 crore of the ₹158 crore pre-tax profit was a non-cash fair-value gain on units of the RKG Special Situations fund.
- The ₹550 crore Wind World India deal adds a 4.5 GW portfolio that earned about ₹580 crore revenue in FY26, nearly 2x Inox Green's own revenue.
- Management guides ₹600 crore annualised EBITDA from H2 FY27; if delivered, the stock trades at roughly 9x forward EV/EBITDA versus 44x trailing P/E today.
- Copernicus view: Watchlist, not yet investable until two consolidated quarters prove the O&M earnings are real.
What is happening with Inox Green shares right now?
Four corporate events landed in ten weeks, and the stock fell through all of them. It slid from ₹150 on 5 October to a lower-circuit close near ₹115 on 8 October, then bounced 9.48% to ₹125.99 on heavy volume of over 5 crore shares. Parent Inox Wind also hit a 52-week low that week, so the selling looked group-wide; we found no company-specific disclosure for the 8 October fall.
| Date (2026) | Event | Why it matters |
|---|---|---|
| 7 Oct | Paid ₹550 crore (incl. taxes) for Wind World India's 4.5 GW O&M business via subsidiary Vibhav Energy (Inox Green to own 75%) | Unlocks line-by-line consolidation from Q3 FY27 |
| Late Sep | QIP of ₹300 crore at ₹165.65 per share, 1.81 crore shares, 5% below floor price | Share count now 41.96 crore; QIP buyers are 24% under water |
| 24 Aug | Allotted 4.9 crore Inox Renewable Solutions (IRSL) shares, 122 for every 1,000 held | Power-evacuation business demerged; Inox Green is now asset-light |
| 7 Aug | Q1 FY27 results: PAT ₹40.8 crore, revenue ₹43.3 crore | Profit up, operating revenue down |
Promoter holding fell to 53.70% in September 2026 from 56.12% in June, diluted by the QIP. FII holding rose to 10.48% and DII to 4.02% over the same quarter.
What does Inox Green Energy do?
Inox Green is India's only listed pure-play renewable operations and maintenance (O&M) company. It keeps wind turbines and solar plants running under long-term contracts, many with annual price escalators (about 5% a year on the Wind World book). Revenue is recurring, and the business needs little capital once the power-evacuation assets were demerged.
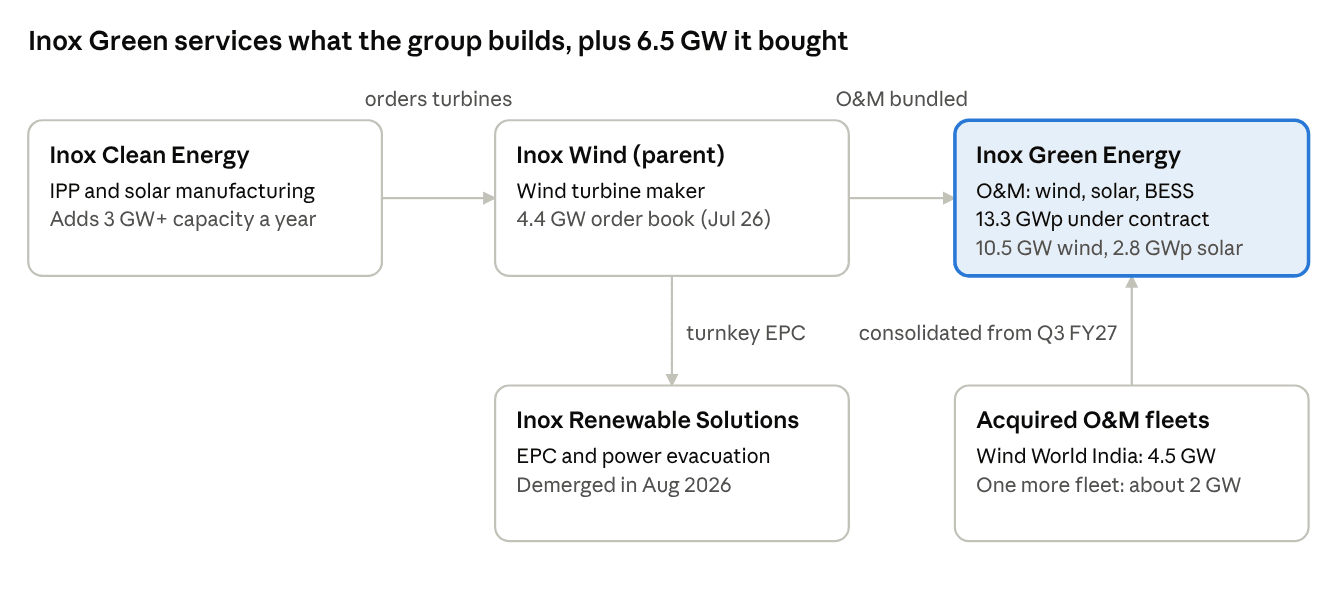
The group loop is the core of the thesis. Inox Clean plans 3 GW+ of new capacity a year, Inox Wind builds the turbines, and each turbine sale brings an O&M contract to Inox Green. Management says blended realisation on the legacy ~4 GW wind fleet is ₹9–10 lakh per MW a year, with the acquired fleets earning substantially more per MW because older turbines need more service.
What is Inox Green's current financial position?
The balance sheet is clean, but the operating business is barely profitable. FY26 (Apr 2025–Mar 2026) revenue grew 28% to ₹281 crore and reported PAT rose 4.7x to ₹103 crore, yet operating profit before other income fell for the second straight year.
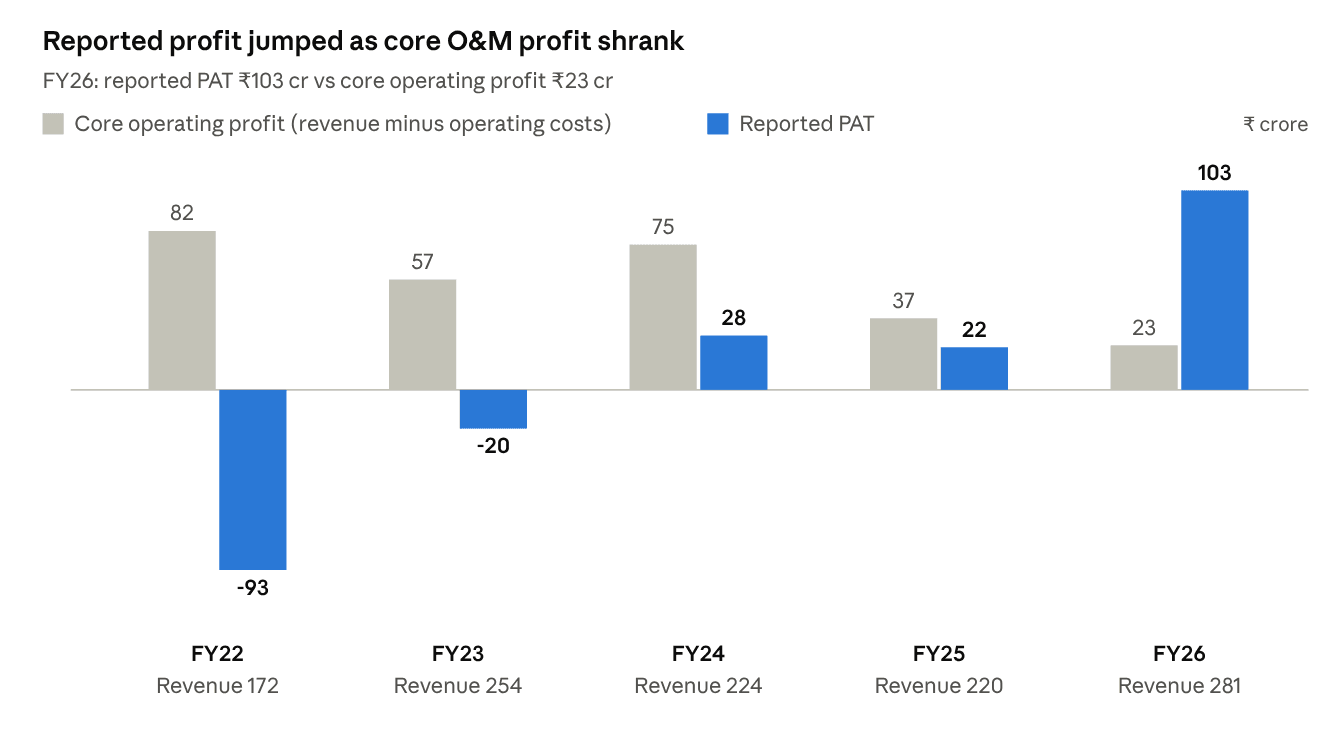
Consolidated, FY22–FY26 (Apr–Mar). FY22–FY24 include the since-demerged power-evacuation business.
Revenue from operations vs other income
Revenue from operations has gone nowhere in four years, while other income has more than quadrupled. In FY26, O&M services made up ₹232 crore (82%) of operating revenue and consultancy ₹38 crore; the jump in other income came almost entirely from the fair-value gain explained below.
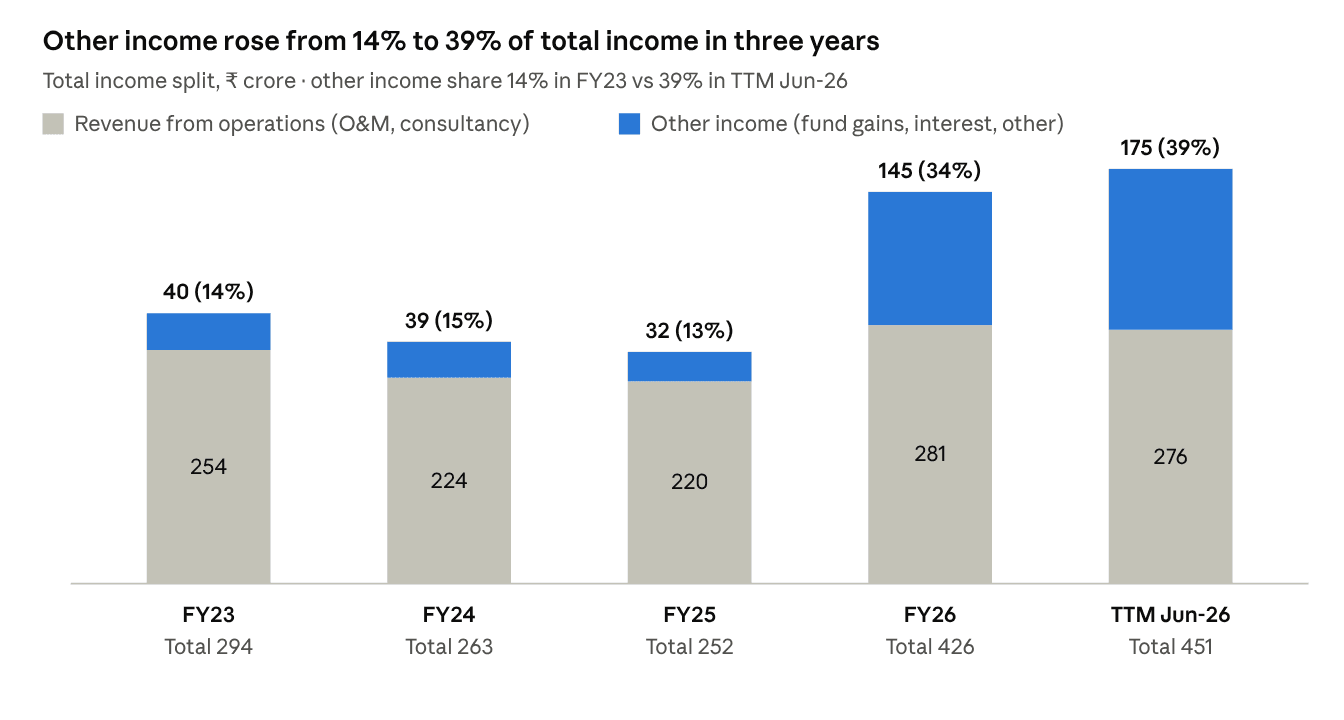
Consolidated. TTM = Jul 2025–Jun 2026.
Q1 FY27 profit and loss
| ₹ crore, consolidated | Q1 FY27 (Apr–Jun 26) | Q1 FY26 | YoY |
|---|---|---|---|
| Revenue from operations | 43.3 | 52.4 | –17% |
| Other income | 57.9 | 33.1 | +75% |
| Operating costs (O&M, staff, other) | 44.2 | 50.1 | –12% |
| Core EBITDA (revenue – operating costs) | –0.9 | 2.3 | n.m. |
| Profit before tax | 54.5 | 31.4 | +73% |
| PAT (deferred tax ₹13.6 cr, current tax ₹0.1 cr) | 40.8 | 22.4 | +82% |
Other income now exceeds revenue. Management says over ₹50 crore of it is "operational income" from the acquired fleets, booked as other income because those fleets were still investments. That claim gets tested once they are consolidated.
Balance sheet: 31 March 2026 vs 2025
| ₹ crore | Mar-26 | Mar-25 | Read-through |
|---|---|---|---|
| Net worth (owners) | 1,708 | 1,967 | Demerger moved assets to IRSL |
| Units of RKG funds (acquisition vehicle) | 550 | 265 | Carried at fair value |
| Cash, FDs and liquid funds | 505 | 229 | From preferential issue |
| Unbilled revenue | 468 | 513 | 1.7x annual revenue |
| Trade receivables | 166 | 180 | About 216 days of sales |
| Loans given (₹98 cr to related parties) | 116 | 364 | Down sharply, still material |
| Borrowings + TReDS | 102 | 181 | Near debt-free |
| Property, plant and equipment | 5 | 694 | Now asset-light |
Cash flow
| ₹ crore | FY26 | FY25 |
|---|---|---|
| Cash from operations | 67 | 60 |
| Cash from investing | –293 | –637 |
| Cash from financing (mostly equity) | +307 | +572 |
Operating cash flow of ₹67 crore covered only 65% of reported PAT. Growth has been funded by about ₹1,266 crore of fresh equity in two years, lifting the share count from roughly 29 crore to 41.96 crore.
Earnings quality check: how much of the profit is real O&M?
Very little, so far. The acquisitions were made through units of RKG Special Situations, an alternative investment fund that subsidiary Tempest Wind holds at fair value through profit and loss. When those units are marked up, the gain is booked as other income, and that gain drove FY26 profit.
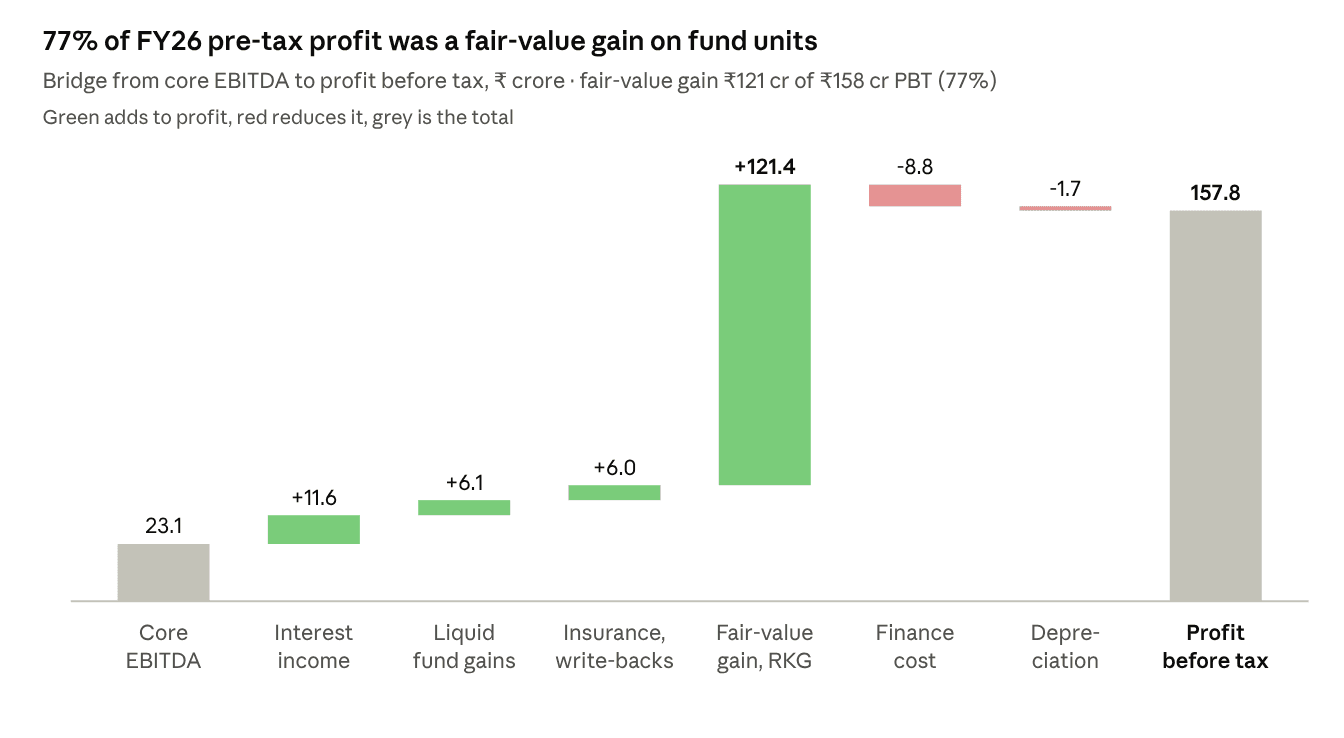
Consolidated. FY26 = Apr 2025–Mar 2026.
Four more flags sit in the accounts:
- ₹112 crore of services rendered but not yet billed carry an auditor's emphasis of matter; billing depends on negotiation, arbitration or litigation with customers.
- Unbilled revenue of ₹468 crore comes from straight-lining contract revenue; it is a timing gap that must eventually turn into cash.
- Tax is mostly deferred: current tax was ₹0.7 crore in FY26 versus ₹52.7 crore deferred, because a ₹197 crore deferred tax asset on past business losses shelters profits. Cash PAT figures flatter the picture.
- ₹55.8 crore of bank guarantees on six SECI wind SPVs were invoked; Inox Wind has agreed to bear any loss, which makes the parent's health part of Inox Green's risk.
The fair fix is to wait for consolidation. Once Wind World is consolidated line by line, its earnings must show up as revenue and EBITDA instead of fund mark-ups.
What are Inox Green's future plans and growth initiatives?
Growth now comes from buying fleets, not building plants. With power evacuation demerged, capex is minimal; the money goes into acquisitions of distressed or under-serviced O&M portfolios and into service upgrades.
| Growth lever | Status (Oct 2026) | What it could add |
|---|---|---|
| Wind World India, 4.5 GW | Paid ₹550 cr on 7 Oct; 75% stake via Vibhav Energy | ~₹580 cr FY26 revenue, ~5% annual escalation; clients include Tata, ReNew, Greenko, Hindustan Zinc |
| Second acquired fleet, ~2 GW | Held as investment; completion targeted in FY27 | Higher revenue per MW than legacy fleet (management, not quantified) |
| Group pipeline (Inox Clean + Inox Wind) | Inox Clean targets 10 GW installed by FY28 | Captive O&M contracts as turbines are commissioned |
| Life-extension and overhauls | Being billed separately from FY27 | Turbine life from 25 to 35 years; a new paid service line |
| Solar, hybrid and BESS O&M | ~2.8 GWp, from near zero at start of FY26 (Bhadla Solar Park among wins) | Diversifies beyond wind |
| Distressed-asset roll-ups | ~10 GW of wind O&M with inactive or stressed operators (company estimate) | Optional upside; likely needs more equity |
Management's targets are ₹600 crore annualised EBITDA from Q3 FY27 and a portfolio above 20 GW "in the near future". Group CFO Akhil Jindal described the Wind World price as about 2x post-synergy EBITDA, which implies roughly ₹275 crore of EBITDA from that book alone. That is ambitious against today's ₹23 crore core EBITDA, and it is the number this stock hinges on.
What management said on the Q1 FY27 call
On the 7 August 2026 call, Inox Green CEO S.K. Mathusudhana called the Wind World deal "a huge milestone" and "value-accretive for all shareholders", promising efficiencies through "enhanced service offerings, price and cost optimization". He reiterated a 50% EBITDA margin guidance for the wind O&M book and said value-added services such as overhauls and life extension, previously absorbed as costs, will be billed separately from FY27. He blamed recent quarters' weak margins on one-time infrastructure and life-extension spending.
The Q&A was tougher. Analysts pressed on why legacy EBITDA sits far below 50%, how much of the ₹57.9 crore other income is operating, and the logic of an equity raise when the business generates cash; management cited the silent period on the fund raise. Asked about the ₹600 crore EBITDA guidance, management confirmed it is an annualised run-rate from Q3–Q4 FY27, not a full-year FY27 figure, and declined to guide on FY28. One analyst noted the group had missed guidance on each of the last three calls.
What the annual report tells us
The FY26 Management Discussion & Analysis sets a target of about 20 GW of O&M portfolio within two years, built on Inox Wind's order book, Inox Clean's 10 GW installed-capacity goal by FY28, solar O&M and selective acquisitions. It sizes the inorganic pool at about 10 GW of wind assets held by inactive, distressed or under-serviced operators. Solar O&M grew from a negligible base to about 3 GWp in one year, including a large contract at Bhadla Solar Park.
Read the headline numbers with care. The MD&A reports FY26 "revenue" of ₹426 crore and EBITDA of ₹210 crore, but both include other income; operating revenue was ₹281 crore. Its own standalone ratios show operating profit margin falling to 34.4% from 45.4%, blamed on higher preventive-maintenance spend, while return on net worth was just 2.8%.
The risk register is candid: it lists competitive pricing pressure, contract non-renewals and cancellations, dependence on wind-rich states and a shortage of skilled technicians. With only 367 permanent employees, absorbing a 4.5 GW fleet will test that workforce.
How fast will India's wind sector grow over the next three years?
The industry body expects annual wind additions to climb from a record 6.05 GW in FY26 to 10 GW by FY29. India's installed wind base stands at 59.2 GW, with 43 GW under construction and a national goal of 100 GW by 2030.
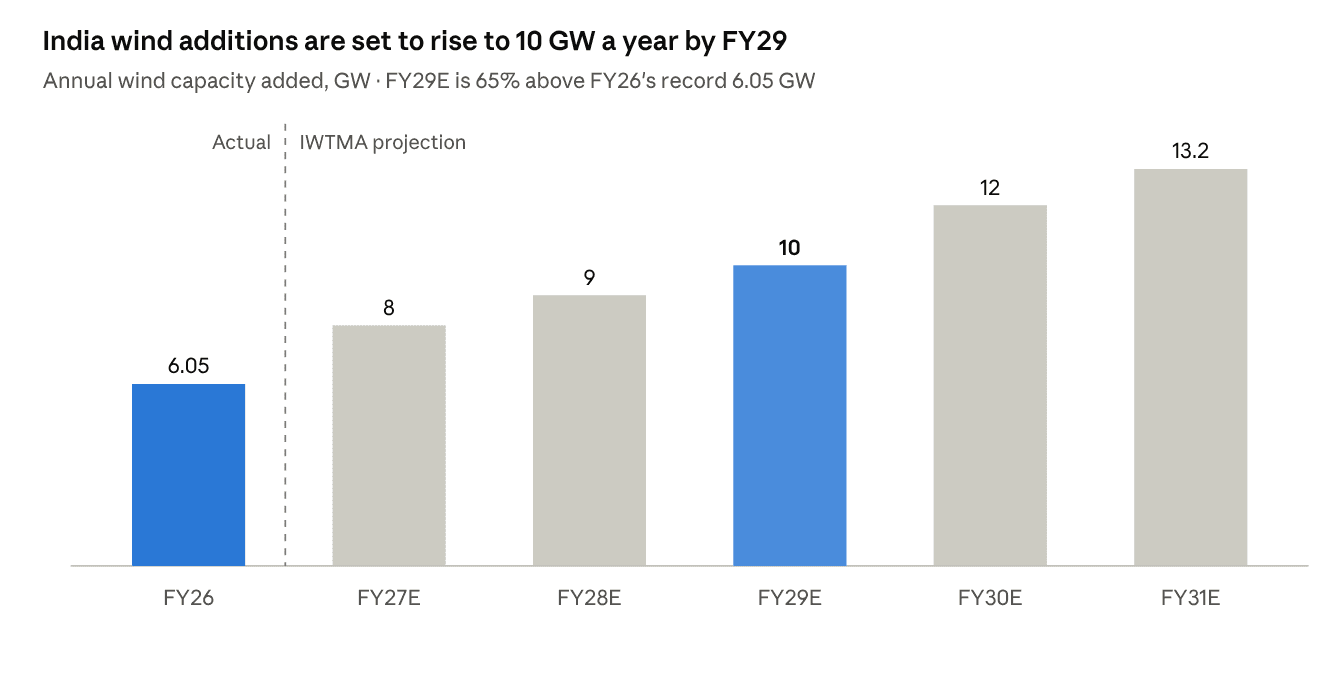
Fiscal years Apr–Mar. FY27E–FY31E are IWTMA projections.
For an O&M company, the installed base matters more than yearly additions, because every commissioned turbine needs 20–25 years of service. Three trends favour Inox Green:
- Fleet growth: about 27 GW added over FY27–FY29 lifts the serviceable base by nearly half.
- Ageing turbines: older machines need overhauls and life extension, which pay more per MW.
- Hybrid and round-the-clock tenders: wind was 25% of the 9.34 GW renewable capacity awarded in Q1 FY27, per Inox management.
The tailwind is real but not exclusive. Suzlon services the largest fleet in India, and turbine makers bundle O&M with every sale.
On which parameters does Inox Green look attractive?
On forward numbers, if guidance holds, Inox Green is cheap; on trailing numbers it is expensive. Here is what works in its favour.
| Parameter | Evidence | Strength |
|---|---|---|
| Forward valuation | EV about ₹5,250 cr vs ₹600 cr guided annual EBITDA = ~9x EV/EBITDA | High, if delivered |
| Scale jump | Portfolio from ~4 GW reporting today to 10.5 GW wind; Wind World revenue ~2x Inox Green's | High |
| Balance sheet | Borrowings ~₹100 cr against ~₹500 cr cash and FDs (Mar-26), before the ₹300 cr QIP | High |
| Recurring, escalating revenue | Multi-year O&M contracts; ~5% annual escalators on the Wind World book | Medium |
| Captive pipeline | Inox Clean adds 3 GW+ a year; Inox Wind order book 4.4 GW | Medium, group-dependent |
| Asset-light model | PP&E ₹5 cr after demerger; future capex mainly acquisitions | Medium |
| Price reset | Stock at ₹126 vs QIP price ₹165.65 and 52-week high ₹279; P/B about 3x | Medium |
EV is our estimate: market cap ₹5,409 cr, plus about ₹100 cr debt, minus about ₹255 cr net cash after the QIP inflow and the ₹550 cr Wind World payment.
Are peer companies more attractive than Inox Green?
Yes, on proven earnings. Suzlon and Waaree Renewable Technologies trade at about 16x trailing P/E with ROE above 39%, while Inox Green trades at 44x with ROE near 5%. India has no other listed pure-play O&M company, so the comparison uses renewable names with service or recurring-revenue exposure.
| Company (NSE) | Business | Market cap (₹ cr) | P/E TTM (x) | ROE (%) | Operating margin (%) |
|---|---|---|---|---|---|
| Inox Green (INOXGREEN) | Pure-play renewable O&M | 5,409 | 44.1 | 5.1 | 8 (core, FY26) |
| Suzlon Energy (SUZLON) | Wind OEM, large O&M fleet | 51,201 | 16.3 | 39.7 | 18 (FY26) |
| Waaree Renewable Tech (WAAREERTL) | Solar EPC and O&M | 8,373 | 16.4 | 68.6 | 19 (FY26) |
| KPI Green Energy (KPIGREEN) | Solar and hybrid IPP | 8,142 | 19.0 | 19.7 | 34 (TTM) |
| Inox Wind (INOXWIND) | Wind OEM, parent | 12,858* | 30.0* | 2.7 | 21 (FY25) |
Data as of 9 Oct 2026, except *Inox Wind (11 Aug 2026; the stock has since fallen to about ₹65). Sterling & Wilson Renewable is excluded as loss-making in FY26.
Copernicus 100-point scorecard
| Criterion (weight) | Inox Green | Suzlon | Waaree RTL |
|---|---|---|---|
| Earnings quality (20) | 6 | 17 | 15 |
| Growth visibility, 3 years (20) | 16 | 15 | 16 |
| Balance sheet (15) | 13 | 13 | 12 |
| Valuation (20) | 10 | 14 | 14 |
| Execution and governance record (15) | 7 | 10 | 11 |
| Sector tailwind (10) | 8 | 9 | 9 |
| Total (100) | 60 | 78 | 77 |
The peers win on the things an investor can verify today: margins, returns and cash conversion. Inox Green wins only on optionality: if the acquired fleets earn what management says, its earnings could multiply in a way the peers cannot.
Bear, base and bull scenarios for FY28
Our probability-weighted value is about ₹150 per share, roughly 19% above the 9 October price. That is a modest edge for a stock with this much execution risk. These are illustrative educational scenarios, not price targets.
| FY28 (Apr 2027–Mar 2028) | Bear | Base | Bull |
|---|---|---|---|
| What happens | Integration slips; acquired margins ~30%; legacy flat | Wind World near 45% margin; legacy core margin recovers to ~20% | Guidance met plus escalators and life-extension upsell |
| Consolidated EBITDA (₹ cr) | 300 | 450 | 650 |
| PAT to owners, after 25% minority in Wind World (₹ cr) | ~190 | ~290 | ~430 |
| EPS on 41.96 cr shares (₹) | 4.5 | 6.9 | 10.2 |
| P/E applied (x) | 18 | 22 | 25 |
| Implied value (₹/share) | 81 | 152 | 256 |
| Probability | 30% | 50% | 20% |
Assumptions: about ₹30 cr treasury income, ₹40 cr depreciation and amortisation, ₹10 cr interest, 25% tax once carried-forward losses are used up. Our base case sits 25% below management's ₹600 crore EBITDA guidance, reflecting the group's recent record of missed targets.
What are the key risks for Inox Green investors?
The biggest risk is that consolidated earnings fall short of what the fund mark-ups implied.
- Earnings reality check: if Wind World EBITDA comes in well below the ~₹275 crore implied by the deal price, FY26–FY27 fair-value gains will look overstated.
- Guidance credibility: on the Q1 FY27 call, analysts noted the group had missed guidance in each of the last three quarters.
- Group dependence: Inox Wind is a key customer, promoter and guarantor of the SPV losses; its Q1 FY27 revenue was flat year on year and its shares hit a 52-week low on 8 Oct 2026.
- Dilution: shares outstanding rose about 43% in two years; a further ₹83.7 crore of preferential money is still to be received, and more acquisitions may need more equity.
- Receivables and unbilled revenue: ₹634 crore of combined trade receivables and unbilled revenue is 2.3x annual revenue.
- Related-party exposure: loans to group entities (₹98 crore) and the unresolved SECI SPV appeal before APTEL.
- Integration risk: Wind World came out of insolvency; client retention and service quality on a 4.5 GW fleet are untested under Inox.
Copernicus Insights: should investors track Inox Green or ignore it?
Track it, but do not chase it. Inox Green is not a stock to ignore: a near-debt-free, asset-light O&M platform that is about to triple its operating base rarely trades at under 10x forward EBITDA. But today's profits are mostly accounting gains, and the group has a record of overpromising. The thesis becomes investable only when consolidated quarters prove the acquired fleets earn real operating profit.
Our stance is Watchlist. For long-term investors, a staggered approach after proof points, rather than a bet on guidance, fits the risk.
Investor watch-list: what to track
| Trigger | Where to see it | What would confirm the thesis |
|---|---|---|
| Wind World consolidation | Q3 FY27 results (Jan–Feb 2027) | Quarterly revenue above ₹150 cr; core EBITDA above ₹60 cr |
| Other income vs revenue | Every quarterly P&L | Other income shrinks; revenue line carries the growth |
| Core EBITDA margin, legacy fleet | Quarterly results, investor deck | Moves toward management's 50% guidance from 8% today |
| Unbilled revenue and the ₹112 cr disputed billing | Half-year balance sheet, auditor notes | Unbilled falls; emphasis of matter removed |
| ₹600 cr annualised EBITDA guidance | Q3 and Q4 FY27 calls | Run-rate of about ₹150 cr a quarter by Q4 FY27 |
| Second ~2 GW fleet completion | Exchange filings | Closed and consolidated within FY27 |
| Inox Wind health | Parent's results and order book | H2 FY27 delivery on its 75% revenue-growth guidance |
| Promoter holding and dilution | Quarterly shareholding pattern | No further equity raise at lower prices; no pledges |
Frequently asked questions
Why did Inox Green shares fall in October 2026?
The stock fell 16% in the week to 9 Oct 2026 and hit a lower circuit on 8 October amid a group-wide sell-off; parent Inox Wind also hit a 52-week low. We found no company-specific disclosure. The fall came just after a ₹300 crore QIP at ₹165.65, leaving new institutional holders under water.
Is Inox Green Energy profitable?
Yes on paper: FY26 PAT was ₹103 crore and Q1 FY27 PAT ₹40.8 crore. But about 77% of FY26 pre-tax profit came from fair-value gains on fund units used to acquire O&M fleets. Core O&M EBITDA was ₹23 crore in FY26 and roughly zero in Q1 FY27.
What is the Wind World India acquisition?
Inox Green paid ₹550 crore, including taxes, on 7 Oct 2026 for Wind World India's 4.5 GW wind O&M business through subsidiary Vibhav Energy, in which it will own 75%. The business earned about ₹580 crore revenue in FY26 and will be consolidated from Q3 FY27.
What is Inox Green's EBITDA guidance for FY27?
Management guides about ₹600 crore of annualised EBITDA from Q3 FY27, after consolidating the acquired fleets. It declined to give FY28 guidance on the Q1 FY27 call. Our base case assumes ₹450 crore in FY28.
Is Inox Green better than Suzlon?
On current numbers, no. Suzlon trades at about 16x trailing P/E with ROE near 40%, against Inox Green's 44x and about 5%. Inox Green offers more upside only if its acquisitions deliver the promised earnings.
Conclusion
This Inox Green Energy share analysis concludes the stock is a watchlist candidate, not yet a buy-and-forget holding. The Wind World deal can transform earnings, but until consolidated results show real O&M profit, reported PAT overstates the business.
This report is for information only and is not an offer or solicitation to buy or sell any security; views and estimates are as of the date of publication and may change without notice. Investments in securities market are subject to market risks; read all the related documents carefully before investing.