Sambhv Steel Tubes share analysis 2026: peer valuation, financials and fair value
At ₹157 (23 Oct 2026), Sambhv Steel Tubes Ltd (NSE: SAMBHV; BSE: 544430) is worth about ₹4,633 crore and trades at 28.1x trailing earnings. That buys a rare listed pipe maker that controls its own chain from sponge iron to finished pipe, earning a 13% EBITDA margin in Q1 FY27.
This Sambhv Steel Tubes share analysis covers the integrated business model, eight quarters of results, the ₹1,135 crore stainless-steel expansion and a detailed peer-to-peer comparison with APL Apollo, JTL Industries, Venus Pipes, Hi-Tech Pipes and Jindal Supreme. We finish with bear, base and bull values and the checkpoints before Q2 FY27 results.
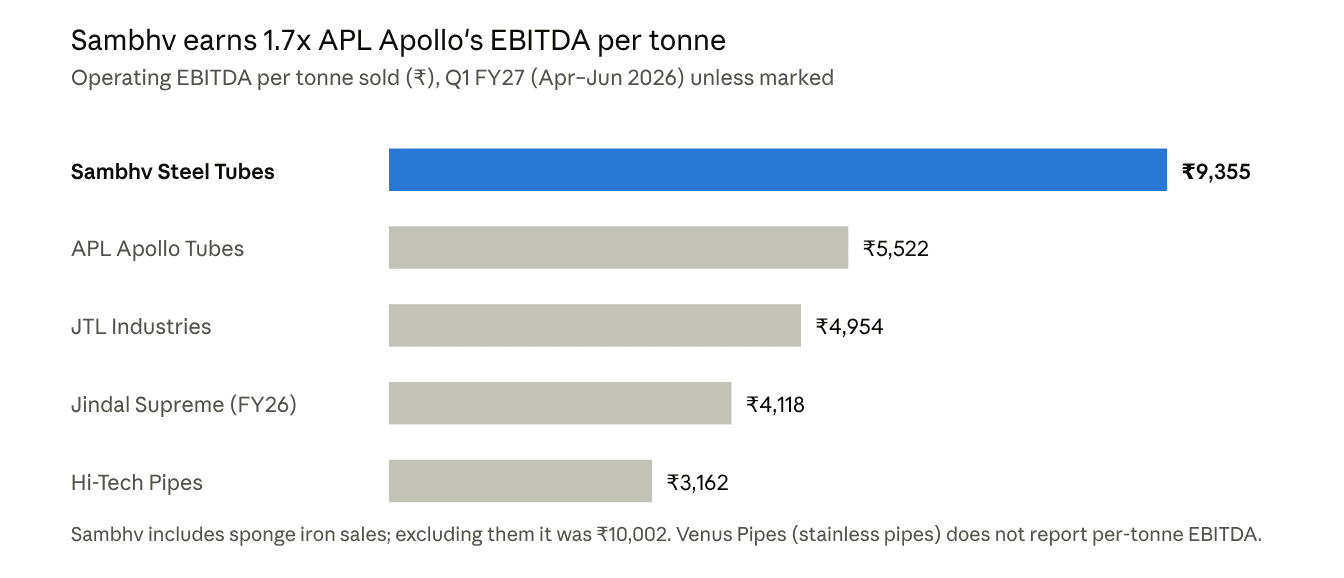
- Best unit economics in the peer set: Q1 FY27 EBITDA of ₹9,355 per tonne, against ₹5,522 at APL Apollo, ₹4,954 at JTL and ₹3,162 at Hi-Tech Pipes, because Sambhv makes its own sponge iron, slabs and HR coil.
- Growth is accelerating: FY26 revenue rose 60% to ₹2,413 crore and PAT 149% to ₹142 crore; Q2 FY27 volumes grew 24% YoY to 1,22,662 tonnes.
- The next leg is stainless steel: a ₹810 crore, 0.36 MTPA stainless-coil greenfield is targeted for Q4 FY27, within ₹1,135 crore of quantified capex.
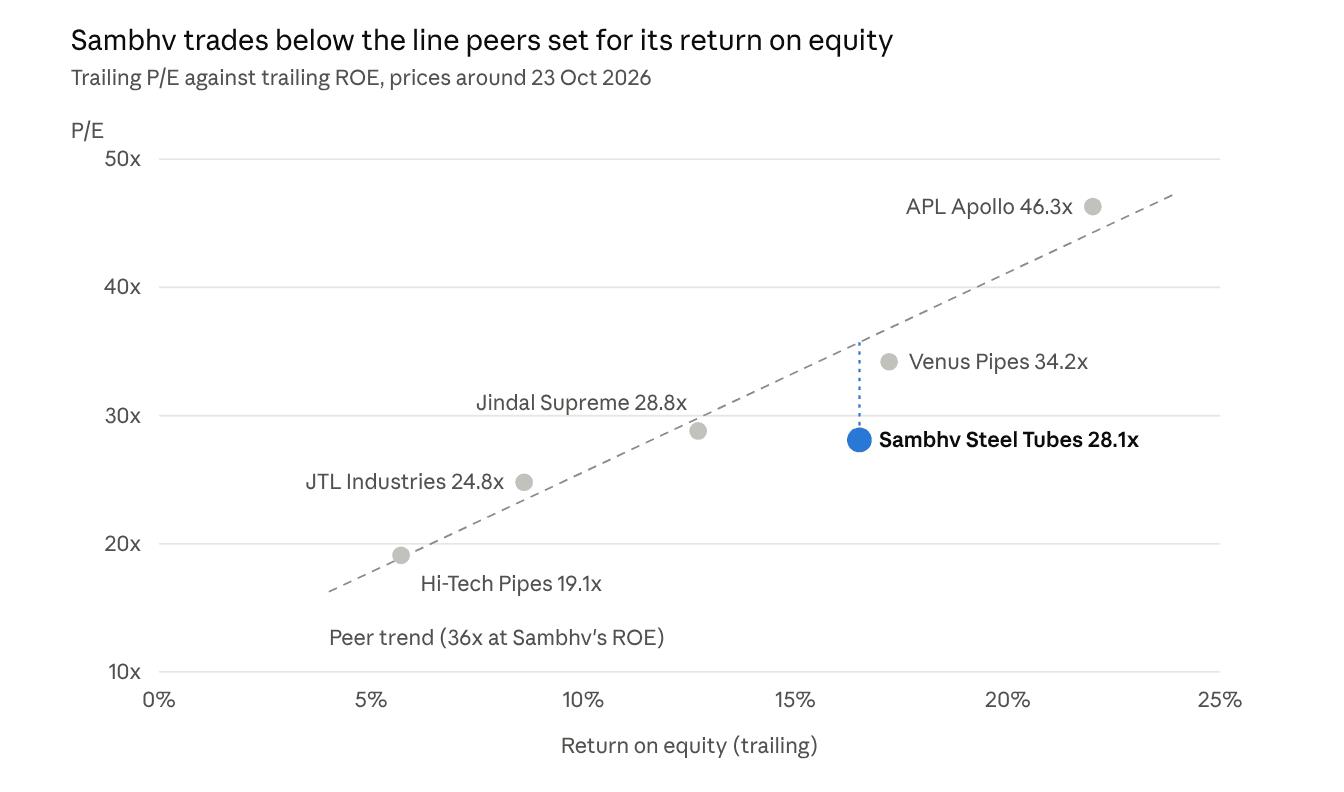
- Valuation is fair, not stretched: 28.1x trailing P/E and 4.4x book for a 16–19% ROE, versus Venus Pipes at 34.2x and APL Apollo at 46.3x.
- Our probability-weighted fair value is about ₹197 on FY28 estimates, roughly 26% above ₹157, with a ₹78–₹320 bear-to-bull range.
What does Sambhv Steel Tubes do?
Sambhv makes ERW steel pipes, pre-galvanised (GP) coils and pipes, and stainless-steel cold-rolled coils, but its edge is upstream. It produces its own sponge iron, slabs and hot-rolled coil, so it captures the margin a typical pipe maker pays away to the steel mill.
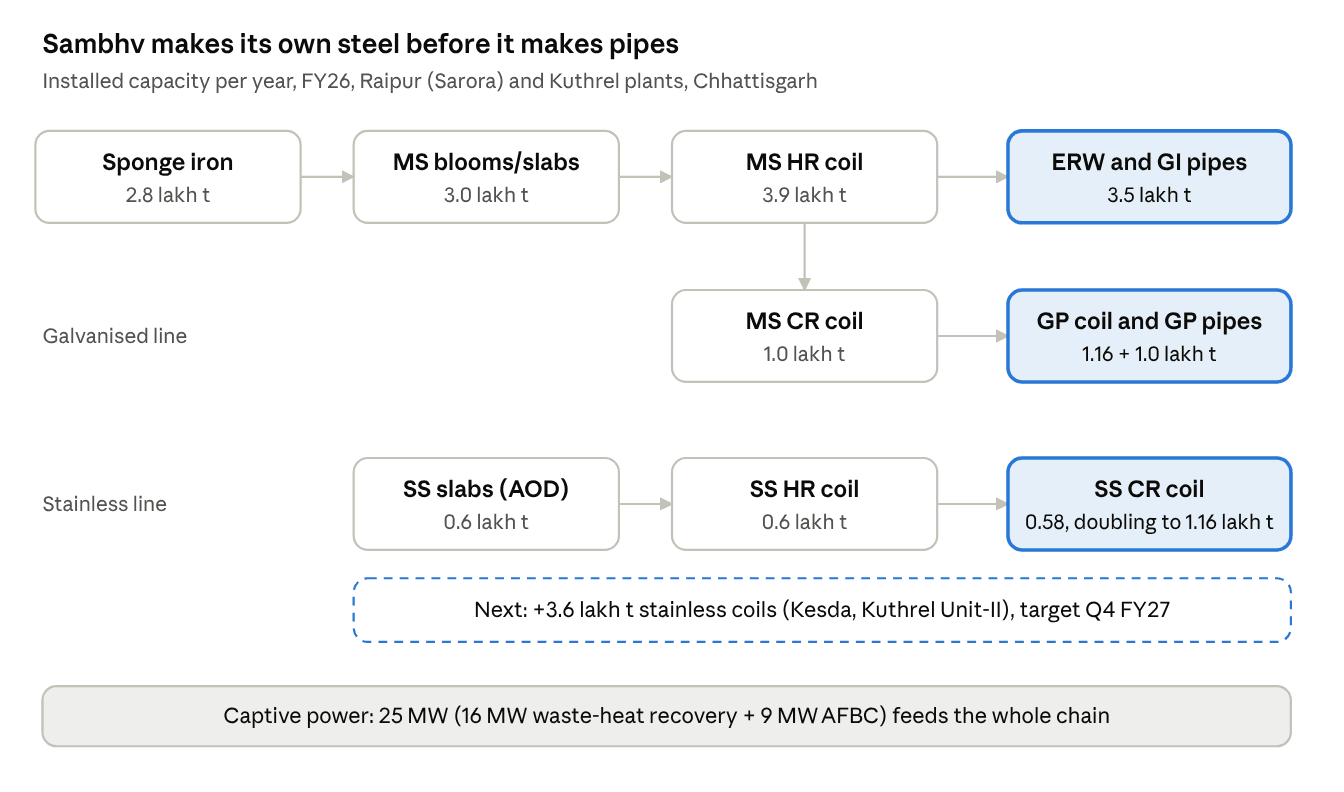
The company was incorporated in 2017 as Sambhv Sponge Power, runs plants at Sarora (Raipur) and Kuthrel in Chhattisgarh, and has land with environmental clearance at Kesda for expansion. It sells through 43 distributors and 700+ dealers across 15 states and one union territory.
Revenue mix, volume mix and utilisation
By value, structural pipes are still 45% of sales, but stainless coils already bring in a quarter of revenue on only 12% of tonnes. Each stainless tonne earns roughly 2.6x the revenue of a pipe tonne, which is why the expansion is aimed there. The applications on each card are typical industry end-uses for that product, not a company-disclosed customer split. Sambhv does not name its buyers: the customer lines show the types it discloses (dealers, fabricators, contractors, institutions), its vendor approvals from Engineers India (EIL) and Chennai Metro Rail (CMRL), and its 28 stainless-pipe MoU partners. The intermediates buyer is a typical type, not a disclosure.
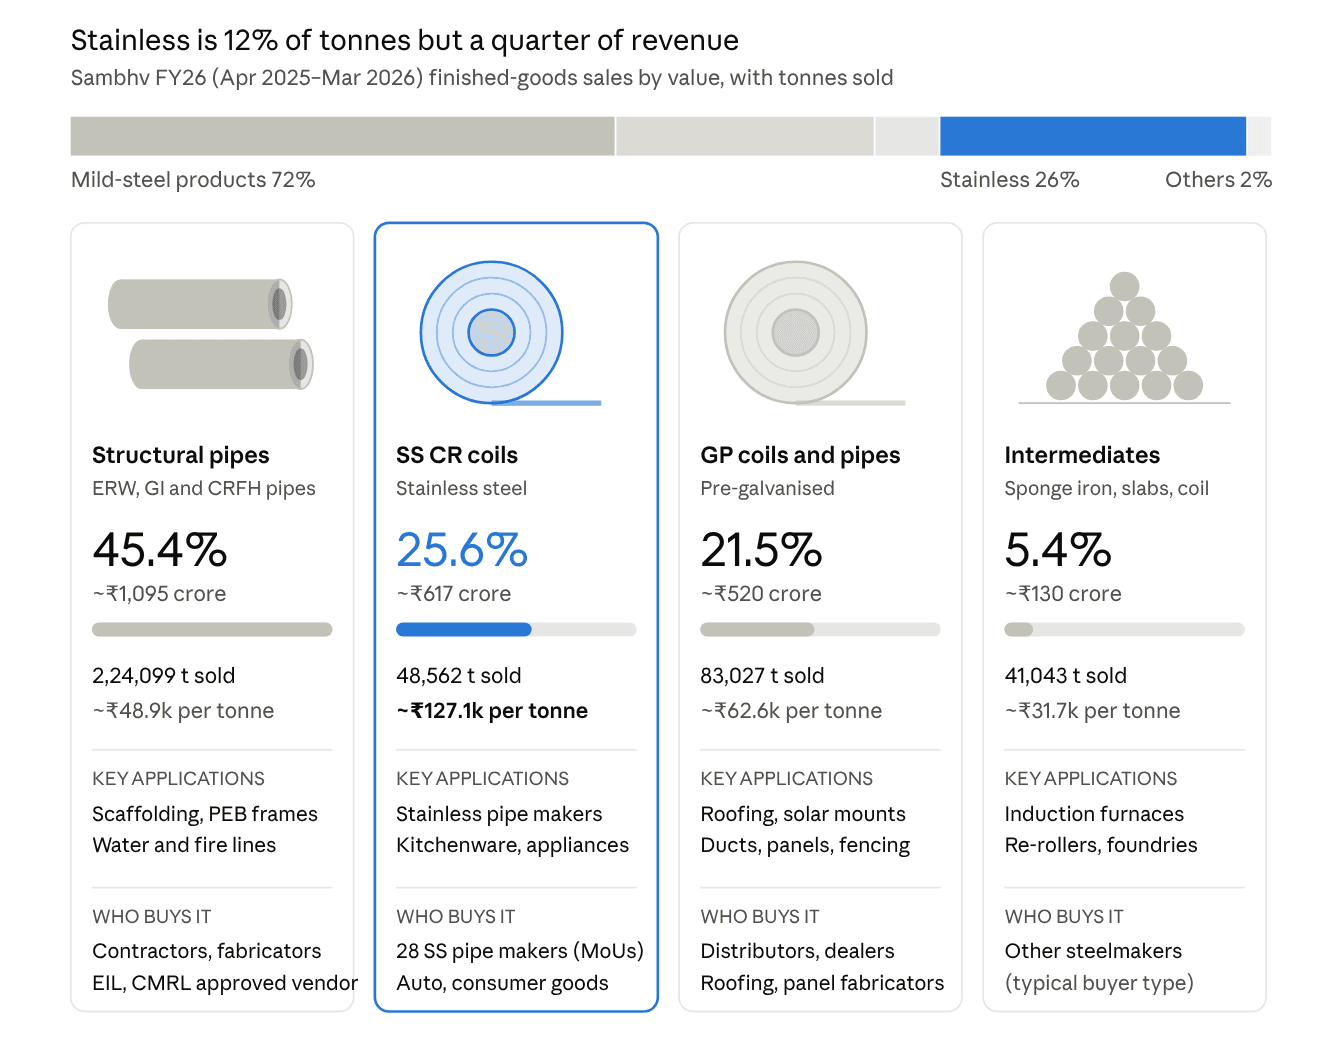
₹ crore and per-tonne figures are our estimates, applying each share to FY26 revenue of ₹2,413 crore; shares are paired with labels in the order printed on the slide. Illustrations are schematic.
Pipes still dominate volumes, but the two value-added coil lines now carry a third of sales. FY26 total sales were 3,96,731 tonnes.
| Product line | FY26 sales (tonnes) | Share of volume | FY26 utilisation |
|---|---|---|---|
| Structural pipes and tubes (ERW, GI, CRFH) | 2,24,099 | 56.5% | ERW & GI pipes 65.4% |
| Pre-galvanised coils and pipes | 83,027 | 20.9% | — |
| Stainless-steel CR coils | 48,562 | 12.2% | — |
| Intermediates sold (sponge iron, slabs, HR/CR coil) | 41,043 | 10.3% | Sponge 81.5%, MS slabs 78.7%, MS HR 55.2% |
The practitioner's read: integration is a double-edged tool. It lifts EBITDA per tonne in good times, but it also brings iron-ore and coal price risk that a pure converter like Jindal Supreme or Hi-Tech Pipes does not carry.
How has Sambhv performed financially?
Sambhv is the only company in our peer set growing above 30% while holding a double-digit EBITDA margin. Q1 FY27 (Apr–Jun 2026) revenue rose 31% YoY to ₹732 crore, EBITDA rose 31% to ₹95 crore and standalone PAT rose 69% to ₹56.6 crore as interest costs fell.
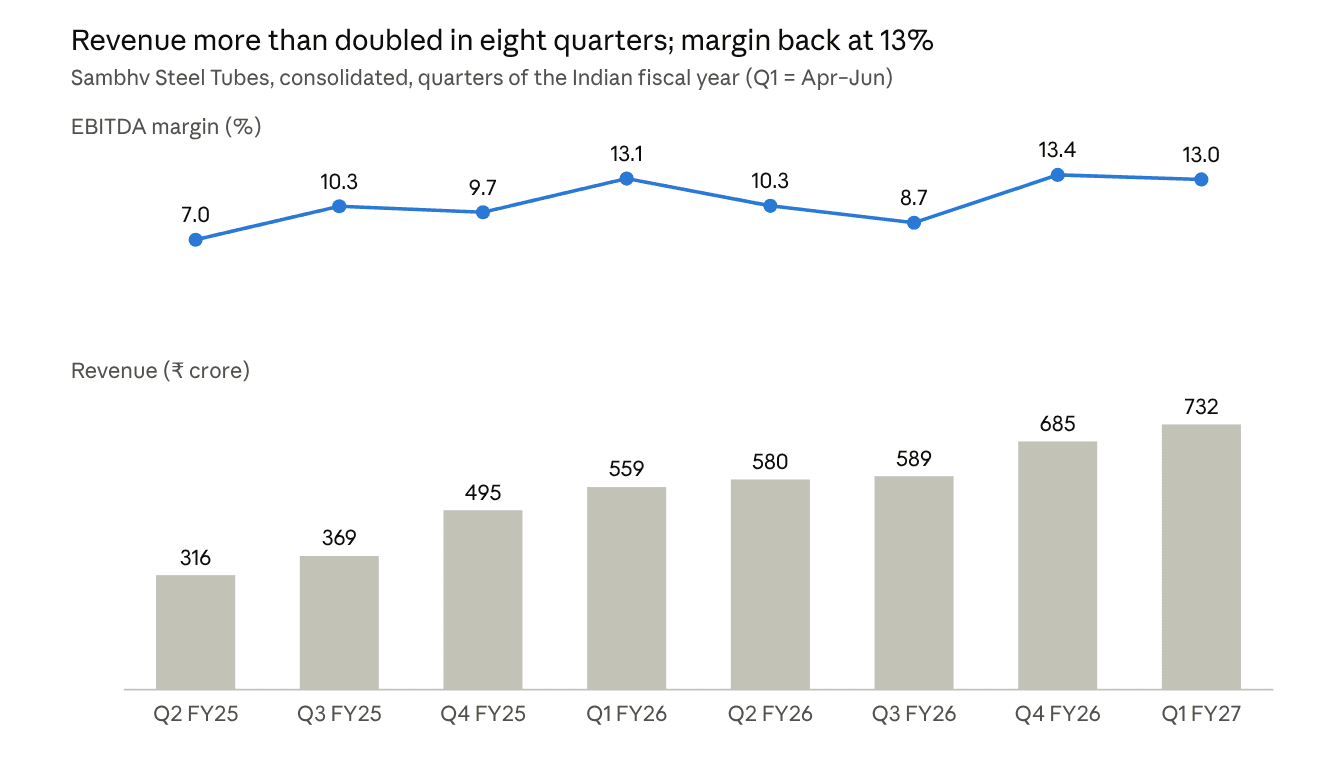
The one soft patch, Q2–Q3 FY26, saw margin dip to 9%. It recovered to 13% within two quarters, which supports the case that the integrated model protects margins better than buy-in converters.
| ₹ crore (consolidated) | FY24 | FY25 | FY26 |
|---|---|---|---|
| Revenue | 1,286 | 1,511 | 2,413 |
| EBITDA | 160 | 154 | 276 |
| EBITDA margin | 12.4% | 10.2% | 11.5% |
| PAT | 82 | 57 | 142 |
| Net worth (year-end) | — | 495 | 1,054 |
| Borrowings (year-end) | — | 507 | 373 |
| Sales volume (tonnes) | — | — | 3,96,731 |
FY24–FY26 revenue CAGR is 37%.
EPS and P/E trend since listing
Earnings caught up with the price, not the other way round. Trailing EPS rose from ₹2.27 to ₹5.59 between June 2025 and June 2026, while the P/E fell from about 48x in October 2025 to 22–23x by mid-2026. The October 2026 rally has lifted it back to 28.1x, still below the ~36x that peers imply for its returns.
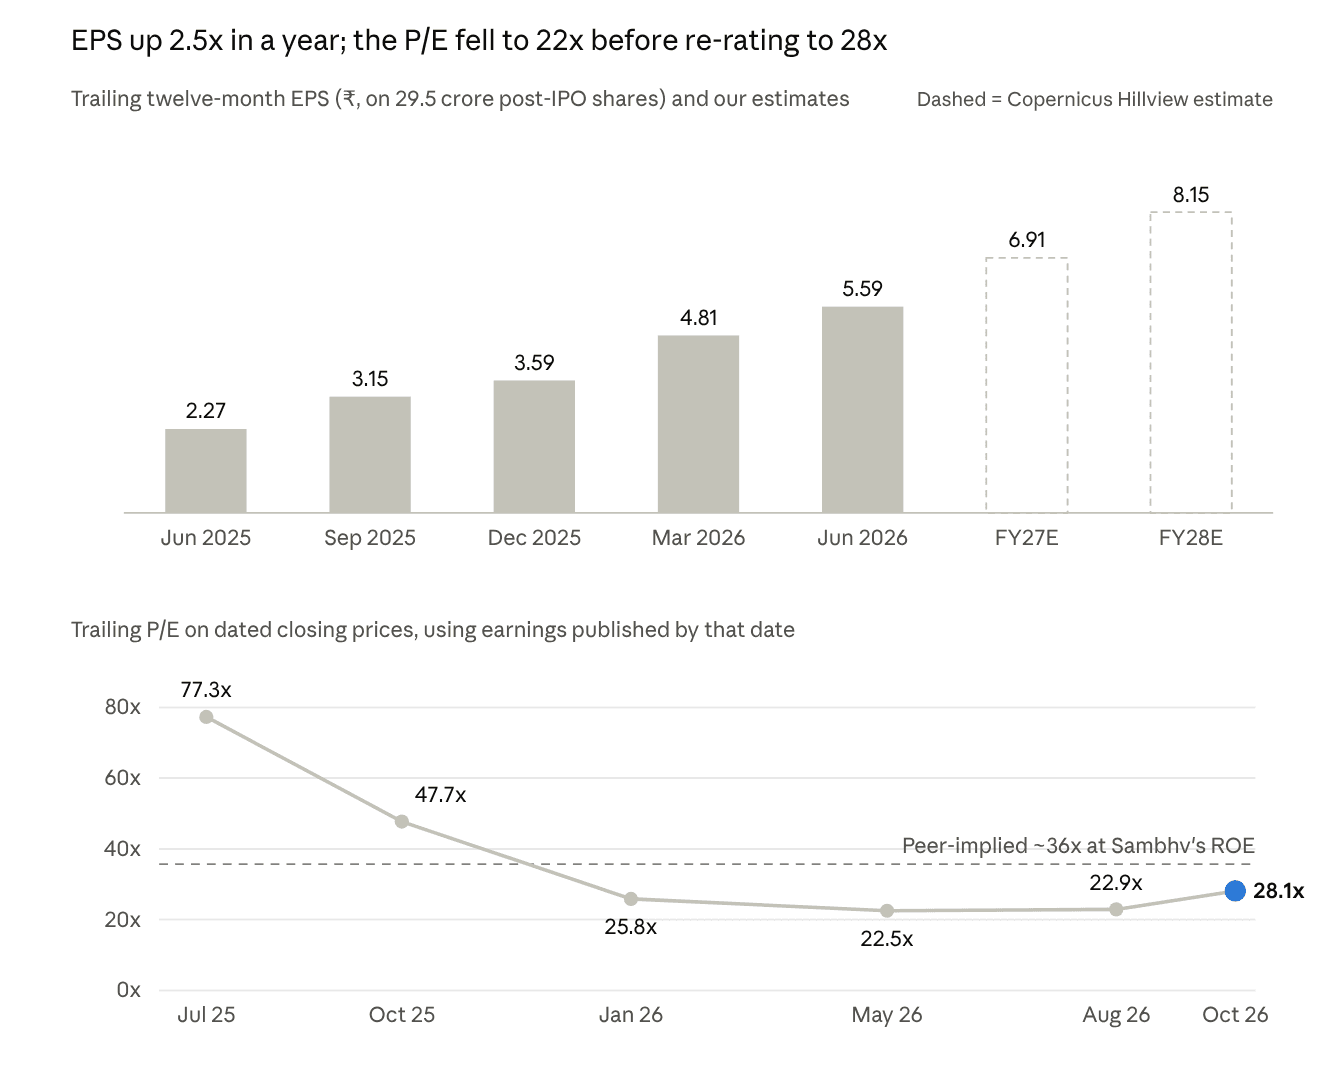
EPS on 29.5 crore shares; FY27E and FY28E are our estimates.
The July 2025 reading of 77x reflects post-listing euphoria on pre-growth earnings, a reminder that the entry price, not the business, drove early returns here. On our estimates, EPS reaches ₹8.15 in FY28, so today's price is about 19x forward earnings.
Cash flow and balance sheet
Unlike many small-cap pipe makers, Sambhv converts profit to cash. FY26 operating cash flow was ₹216 crore after tax on ₹142 crore of PAT, and the working-capital cycle was 17 days (21 days in Q1 FY27).
The July 2025 IPO raised ₹440 crore of fresh equity, which more than doubled net worth and cut borrowings by ₹134 crore. Net debt stood at 1.0x annualised EBITDA in June 2026, up from 0.78x in March as capex picked up.
Q2 FY27 is already visible in volumes
Q2 FY27 (Jul–Sep 2026) sales volume was 1,22,662 tonnes, up 24.2% YoY and 13.8% QoQ, a record. Management guided Q2 EBITDA of ₹7,500–8,500 per tonne. At the midpoint, that implies Q2 EBITDA near ₹98 crore, our estimate, against ₹60 crore a year ago.
What is Sambhv's stainless-steel expansion plan?
Sambhv plans to triple finished-product capacity from about 0.68 MTPA to more than 2 MTPA over four to five years, led by stainless-steel coils. Quantified projects add up to ₹1,135 crore, larger than the company's entire FY26 net worth of ₹1,054 crore.
| Project | Capex (₹ crore) | Target | Status (late Jul 2026) |
|---|---|---|---|
| Phase-I greenfield: 0.36 MTPA stainless coils (Kesda + Kuthrel Unit-II) | 810 | Q4 FY27 | Hot rolling mill civil ~80–90%, erection ~20%; melt shop civil ~30–40% |
| 25 MW power plant, Kesda | 125 | Q4 FY27 | Machinery ordered; civil ~90%, erection ~30% |
The two key projects are shown; the ₹1,135 crore total also includes smaller projects not listed here.
Why stainless, and how it is funded
Stainless coil is the logical next step: Sambhv already sells it to pipe makers and has signed MoUs with 28 stainless-pipe partners. Its higher realisation per tonne means the mix shift should lift blended EBITDA per tonne once the plant runs.
Funding comes from three places: operating cash flow (₹216 crore in FY26), ₹100 crore of convertible warrants allotted at ₹115 each (86.95 lakh warrants), and new debt. We estimate net debt could peak near 2x EBITDA in FY28 before the new capacity pays back. That is manageable, but it leaves less room for a steel downcycle than today's 1.0x.
The practitioner's caution: the melt shop, the most complex piece, was only about a third built in July. A one- or two-quarter slip past Q4 FY27 is our base expectation for full stainless ramp-up, and our model assumes it.
How does Sambhv compare with its peers, peer to peer?
Sambhv wins on unit economics and growth, trails APL Apollo on returns and balance sheet, and is priced at a discount to what peers' valuations imply for its returns. We compare it with five listed pipe makers: leader APL Apollo, two fast-growing converters (JTL Industries, Hi-Tech Pipes), stainless-pipe maker Venus Pipes and recent IPO Jindal Supreme.
1. Profit per tonne: the integration dividend
The clearest gap is EBITDA per tonne. Sambhv earns ₹9,355 a tonne because it buys iron ore and coal, not hot-rolled coil; every peer here buys coil from a steel mill and keeps only the conversion margin.
2. Growth, margin, returns and leverage
On the scorecard that matters to equity holders, Sambhv is the only company with both 30%+ growth and a double-digit margin. Venus earns a higher margin in stainless pipes but grows half as fast; APL Apollo earns higher returns with net cash.
| Company (NSE) | Market cap, 23 Oct (₹ crore) | Q1 FY27 revenue growth | Q1 FY27 EBITDA margin | ROE (trailing) | Leverage | Model |
|---|---|---|---|---|---|---|
| Sambhv Steel Tubes (SAMBHV) | 4,633 | +31.0% | 13.0% | 16.5% | Net debt 1.0x EBITDA | Integrated, sponge iron to pipe and SS coil |
| APL Apollo Tubes (APLAPOLLO) | 56,920 | +8.5% | 7.3% | ~22% | Net cash ~₹1,400 crore | Branded converter, 55–65% share in structural tubes |
| Venus Pipes & Tubes (VENUSPIPES) | 3,543 | +16.0% | 16.1% | 17.2% | Not compared | Stainless pipes and tubes |
| JTL Industries (JTLIND) | 2,850 | +32.7% | 8.1% | 8.6% | Not compared | Converter, expanding to 2 MTPA |
| Hi-Tech Pipes (HITECH) | 1,438 (16 Oct) | +78.5% | 3.5% | 5.7% | Not compared | Volume converter, 1 MTPA |
| Jindal Supreme (JSIPL) | 706 | +11.4% | 7.2% | 12.7% post-IPO | ~0.11x debt/equity post-IPO | Converter, single plant |
Net debt for JTL, Venus and Hi-Tech is not uniformly disclosed, so we leave it out rather than estimate.
3. Valuation: the market is not yet paying for the returns
Across the six, P/E rises with return on equity, as it should. On that peer line, a 16.5% ROE would justify roughly 36x; Sambhv trades at 28.1x, about a 21% discount.
| Company | Price / book | Market cap / TTM sales |
|---|---|---|
| APL Apollo Tubes | 10.2x | 2.49x |
| Venus Pipes & Tubes | 5.1x | 2.93x |
| Sambhv Steel Tubes | 4.4x | 1.79x |
| Jindal Supreme | 3.7x | 1.02x |
| JTL Industries | 2.1x | 1.23x |
| Hi-Tech Pipes | 1.1x | 0.30x |
Sambhv P/B on March 2026 net worth of ₹1,054 crore. On an enterprise basis, Sambhv trades at about 16.5x trailing EBITDA of ₹298 crore.
4. What explains the discount, and is it fair?
Three things hold the multiple back, and only one is durable. First, integration means commodity exposure: a fall in steel prices hits a sponge-iron producer's spread harder than a converter's. Second, the ₹1,135 crore capex is large against the balance sheet and still under construction. Third, liquidity: promoters own 56% and institutions only about 5.7%, so few funds yet own or cover it.
The last two fade with execution: a commissioned stainless plant and wider institutional ownership would close much of the gap to Venus. The commodity discount is permanent and fair, which is why we do not use the full 36x peer-line multiple in our valuation.
What is Sambhv Steel Tubes' fair value?
Our probability-weighted fair value is about ₹197 per share on FY28 (Apr 2027–Mar 2028) earnings, roughly 26% above ₹157. The upside rests on the stainless plant commissioning on time; without it, the stock is close to fully priced.
Our model assumptions
We assume FY27 volume of about 4.7 lakh tonnes (Q1 and Q2 already total 2.3 lakh), a 12.2% EBITDA margin and rising interest and depreciation as capex is capitalised. FY28 adds the first year of stainless output. EPS uses 30.4 crore shares, including the 86.95 lakh warrants.
| ₹ crore unless stated | FY26 (actual) | FY27E | FY28E |
|---|---|---|---|
| Revenue | 2,413 | 2,950 | 4,000 |
| EBITDA margin | 11.5% | 12.2% | 12.0% |
| EBITDA | 276 | 360 | 480 |
| Depreciation + interest | ~86 (net of other income) | 90 | 160 |
| PAT | 142 | 210 | 248 |
| EPS, fully diluted (₹) | 4.82 (reported) | 6.91 | 8.15 |
| P/E at ₹157 | 32.6x | 22.7x | 19.3x |
Tax at 22%. Management guided FY27 revenue and EBITDA growth of only 10–15% with a ~12% margin, per the Q1 FY27 call; our FY27 revenue estimate is above that because H1 volumes already run 20% ahead of last year.
Why ₹4,000 crore in FY28? The revenue bridge
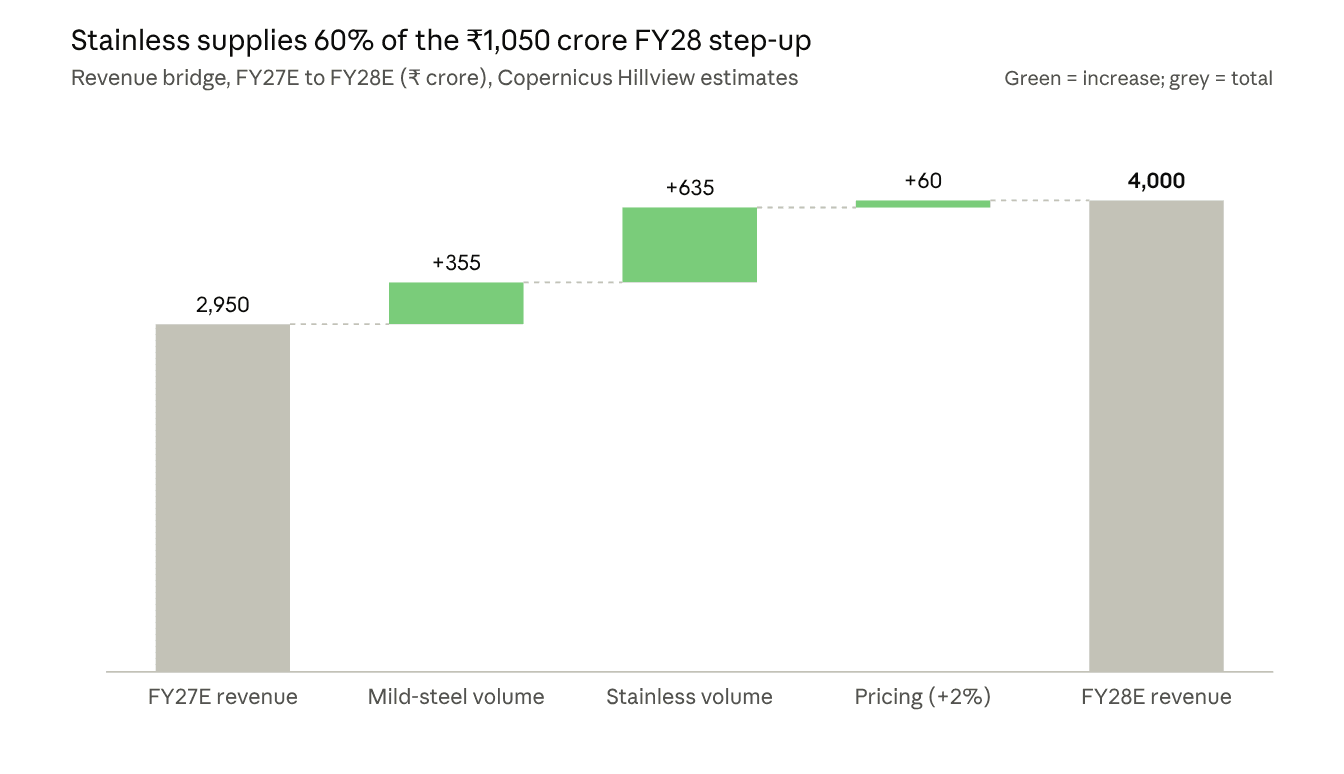
The jump from ₹2,950 crore to ₹4,000 crore is ₹1,050 crore (+36%), faster than FY27's 22%, and it is almost entirely a capacity story. About 60% comes from stainless coil, the product that earns roughly 2.6x a pipe tonne's revenue.
| Driver | FY27E | FY28E | Revenue added | Why we assume it |
|---|---|---|---|---|
| Mild-steel volume (pipes, GP, intermediates) | ~4.10 lakh t | ~4.67 lakh t (+14%) | +₹355 crore at ~₹62,000/t | H1 FY27 volumes are already +20% YoY; ERW pipe utilisation was 65% in FY26; the 1.5 lakh t DFT brownfield adds room |
| Stainless coil volume | ~0.60 lakh t | ~1.10 lakh t | +₹635 crore at ~₹1.27 lakh/t | CR coil debottlenecking to 1.16 lakh t (consent received) plus a first-year ramp of the 0.36 MTPA greenfield |
| Pricing | — | +2% | +₹60 crore | Modest steel-price inflation; no mix benefit counted twice |
| Total | ₹2,950 crore | ₹4,000 crore | +₹1,050 crore |
The stainless assumption is the one to test. An extra 0.5 lakh t is only about 14% utilisation of the new 3.6 lakh t greenfield in its first year, which we consider conservative if it commissions in Q4 FY27. At full utilisation the greenfield alone could add roughly ₹4,500 crore of revenue at FY26 stainless realisations.
If the greenfield slips by a year, debottlenecking alone adds perhaps 0.2 lakh t of stainless and FY28 revenue lands nearer ₹3,600 crore. Our bear case goes further, to ₹3,300 crore, by also assuming weaker steel prices.
Bear, base and bull scenarios
| Scenario | Probability | FY28E revenue (₹ crore) | EBITDA margin | FY28E EPS (₹) | Exit P/E | Value per share | vs ₹157 |
|---|---|---|---|---|---|---|---|
| Bear: stainless delayed a year, steel spreads compress | 25% | 3,300 | 10.0% | 4.32 | 18x | ₹78 | −50% |
| Base: stainless ramps through FY28 | 50% | 4,000 | 12.0% | 8.15 | 24x | ₹196 | +25% |
| Bull: stainless at full run-rate, mix lifts margin | 25% | 4,500 | 13.5% | 11.42 | 28x | ₹320 | +104% |
| Probability-weighted | ₹197 | +26% |
Our base multiple of 24x is deliberately below the 36x peer-line multiple and Venus Pipes' 34x, to keep a discount for commodity exposure and capex risk.
Our analyst view (educational, not a recommendation)
Sambhv clears both our quality screens: positive operating leverage (Q1 PAT +69% on revenue +31%) and strong cash conversion. It is one of the few names in our coverage where the bull case offers a double, but that bull case needs a capex project still a third built.
In our framework, the better risk-reward sits below ₹140, around 17x FY28E EPS and within its September 2026 trading range. Staggered accumulation around commissioning milestones suits this name better than a single entry.
What are the key risks for Sambhv Steel Tubes?
The two risks that matter most are execution on the stainless project and the commodity cycle; the rest are second order.
| Risk | Evidence | What would confirm it |
|---|---|---|
| Capex execution | ₹1,135 crore of projects against ₹1,054 crore net worth; melt shop ~30–40% built in July 2026 | Commissioning pushed beyond Q1 FY28, or a capex overrun |
| Commodity spreads | Integrated chain carries iron-ore, coal and steel-price risk; margin fell to 8.7% in Q3 FY26 | Two quarters of EBITDA per tonne below ₹7,000 |
| Rising leverage | Net debt/EBITDA rose from 0.78x (Mar 2026) to 1.0x (Jun 2026) | Net debt above 2.5x EBITDA during construction |
| Geographic and plant concentration | All plants in Chhattisgarh; sales across 15 states | Any plant outage or state power-tariff shock |
| Guidance credibility | FY27 guidance of 10–15% EBITDA growth sits well below the Q1 run-rate | A Q2–Q3 margin reset toward 10–11%, which would validate the cautious guide |
Dilution is a minor watch item: the 86.95 lakh warrants add about 2.9% to the share count when converted, already included in our EPS.
What should investors watch next?
Q2 FY27 (Jul–Sep 2026) results are the next checkpoint and are due by 14 Nov 2026 under SEBI's 45-day rule. Record volumes are already known, so the market will judge the quarter on EBITDA per tonne and on capex progress.
| Checkpoint | Expected timing | What would support the base case |
|---|---|---|
| Q2 FY27 results | By 14 Nov 2026 | EBITDA per tonne at or above ₹8,000 (top half of the ₹7,500–8,500 guide); EBITDA near ₹98 crore |
| H1 FY27 balance sheet and cash flow | With Q2 results | Net debt/EBITDA at or below 1.3x despite capex |
| Q3 FY27 sales-volume update | Early Jan 2027 | Volumes of 1.25 lakh tonnes or more |
| Stainless CR coil debottlenecking to 1.16 lakh t | FY27 (consent received) | Stainless coil sales above 20,000 t a quarter |
| Phase-I stainless greenfield and 25 MW power plant | Target Q4 FY27 (Jan–Mar 2027) | Hot rolling mill and power plant commissioned on time |
The demand backdrop is supportive: pipe and tube demand tracks construction and infrastructure spending, and stainless coil sells into a fast-growing domestic pipe and appliance market. The question is no longer demand, but whether a ₹4,600 crore company can build a second steel plant on time and on budget.
Frequently asked questions
What is the P/E ratio of Sambhv Steel Tubes?
At ₹157 (23 Oct 2026), Sambhv trades at about 28.1x trailing twelve-month consolidated earnings of ₹165 crore. On our estimates it falls to 22.7x FY27 and 19.3x FY28 earnings, on 30.4 crore fully diluted shares.
Who are Sambhv Steel Tubes' competitors?
In pipes and tubes, Sambhv competes with APL Apollo Tubes, JTL Industries, Hi-Tech Pipes and smaller makers such as Jindal Supreme. In stainless coils it supplies pipe makers similar to Venus Pipes & Tubes. None of these listed peers makes its own sponge iron and hot-rolled coil, which is Sambhv's main point of difference.
Is Sambhv Steel Tubes better than APL Apollo?
They are different businesses. Sambhv earns 1.7x APL Apollo's EBITDA per tonne and grew 31% in Q1 FY27 against 8.5%. APL Apollo is 12 times larger, holds net cash, owns a dominant brand and earns a higher ROE. Sambhv offers faster growth; APL Apollo offers lower risk.
Is Sambhv Steel Tubes a good stock to buy?
We do not make buy or sell calls. Our analysis finds strong unit economics and cash conversion at a valuation about 21% below what peers imply for its returns. Our probability-weighted fair value is about ₹197; please consult a SEBI-registered adviser before investing.
What is Sambhv's stainless-steel expansion?
A ₹810 crore Phase-I greenfield adds 0.36 MTPA of stainless-steel coils at Kesda and Kuthrel Unit-II, Chhattisgarh, with a Q4 FY27 target. Separately, stainless CR coil capacity at Kuthrel is being doubled from 58,000 to 1,16,000 tonnes.
When will Sambhv announce Q2 FY27 results?
Results for the quarter ended 30 Sep 2026 are due by 14 Nov 2026. Volumes are already out: a record 1,22,662 tonnes, up 24% year on year.
Conclusion
Our Sambhv Steel Tubes share analysis finds the strongest unit economics in its listed peer group, ₹9,355 EBITDA per tonne and 30%+ growth, priced about 21% below what peers imply for its returns. The discount is partly earned by commodity and capex risk, which leaves a fair value near ₹197 and a more comfortable entry below ₹140.
For the smaller converter in the same peer set, read our Jindal Supreme share analysis, and see the Indian steel and metals sector hub for the full coverage list.
Related research: Jindal Supreme share analysis
Sources
- Sambhv Q4 FY26 investor presentation, NSE
- Sambhv Q1 FY27 investor presentation, NSE
- Sambhv Q2 FY27 sales volume update, NSE
- Q2 FY27 volume report, Free Press Journal
- Sambhv consolidated financials and shareholding, Screener
- Sambhv Q1 FY27 call and FY27 guidance summary, multibagg.ai
- APL Apollo Tubes FY26 press release
- Hi-Tech Pipes Q1 FY27 investor presentation, NSE
- Venus Pipes & Tubes Q1 FY27 press release, NSE
- JTL Industries Q1 FY27 summary, multibagg.ai
- JTL Industries valuation, Value Research (23 Oct 2026)
- Venus Pipes valuation, Value Research (23 Oct 2026)
- Peer comparison incl. Sambhv and Hi-Tech, Value Research
This report is for information only and is not an offer or solicitation to buy or sell any security; views and estimates are as of the date of publication and may change without notice. Investments in securities market are subject to market risks; read all the related documents carefully before investing.