Jindal Supreme share analysis 2026: peer valuation, financials and fair value
At ₹138.40 (NSE close, 23 Oct 2026), Jindal Supreme (India) Ltd (NSE: JSIPL; BSE: 544935) is worth about ₹706 crore and trades at 28.8x trailing earnings. That is 49% above its ₹93 IPO price but 36% below its post-listing high of ₹214.96.
This Jindal Supreme share analysis covers the business, four years of restated financials, the post-IPO balance sheet and a detailed peer valuation against APL Apollo Tubes, Hi-Tech Pipes, Sambhv Steel Tubes and Vibhor Steel Tubes. We close the reading with a bear, base and bull fair-value range and the triggers to watch before Q2 FY27 results.
- Operating leverage is real: FY26 (Apr 2025–Mar 2026) revenue rose 15.2% to ₹675.4 crore while EBITDA rose 61% to ₹41.6 crore; margin went from 3.27% in FY24 to 6.16%, and 7.2% in Q1 FY27.
- The IPO cleans the balance sheet: ₹71 crore of the ₹99.9 crore fresh issue repays debt, cutting borrowings from ₹92.5 crore (Jun 2026) to roughly ₹21 crore.
- Valuation sits mid-pack: 28.8x trailing P/E and 16.4x EV/EBITDA, cheaper than APL Apollo (49.7x) and Sambhv (30.8x), dearer than Hi-Tech Pipes (19.1x).
- EBITDA of ₹4,118 per tonne in FY26 beats Hi-Tech Pipes (₹3,162/t in Q1 FY27) but trails APL Apollo (₹5,161/t) and Sambhv (₹9,355/t).
- Our probability-weighted fair value is about ₹161 (FY28 basis), roughly 16% above the current price, with a wide ₹68–₹246 bear-to-bull range.
What does Jindal Supreme do?
Jindal Supreme makes ERW mild-steel pipes, galvanised pipes, highway crash barriers and GI tubular poles at a single 16-acre plant in Hisar, Haryana. Founded in 1974 as Janak Steel Tubes, it is run by promoter and MD Abhishek Jindal and should not be confused with the much larger Jindal Steel, Jindal Saw or JSW companies.
The company sells mainly B2B. Direct sales to contractors and institutions made up 68.2% of FY26 revenue and its 53 dealers the remaining 31.8%. Every rupee is earned in India, and Haryana, Rajasthan, Punjab and Uttar Pradesh together supplied 68.6%.
Product mix and capacity
The two newer lines, crash barriers (launched FY25) and GI poles (FY26), already contribute 22% of revenue. They are the margin story: tender-driven road-safety and street-lighting products earn more per tonne than commodity black pipe.
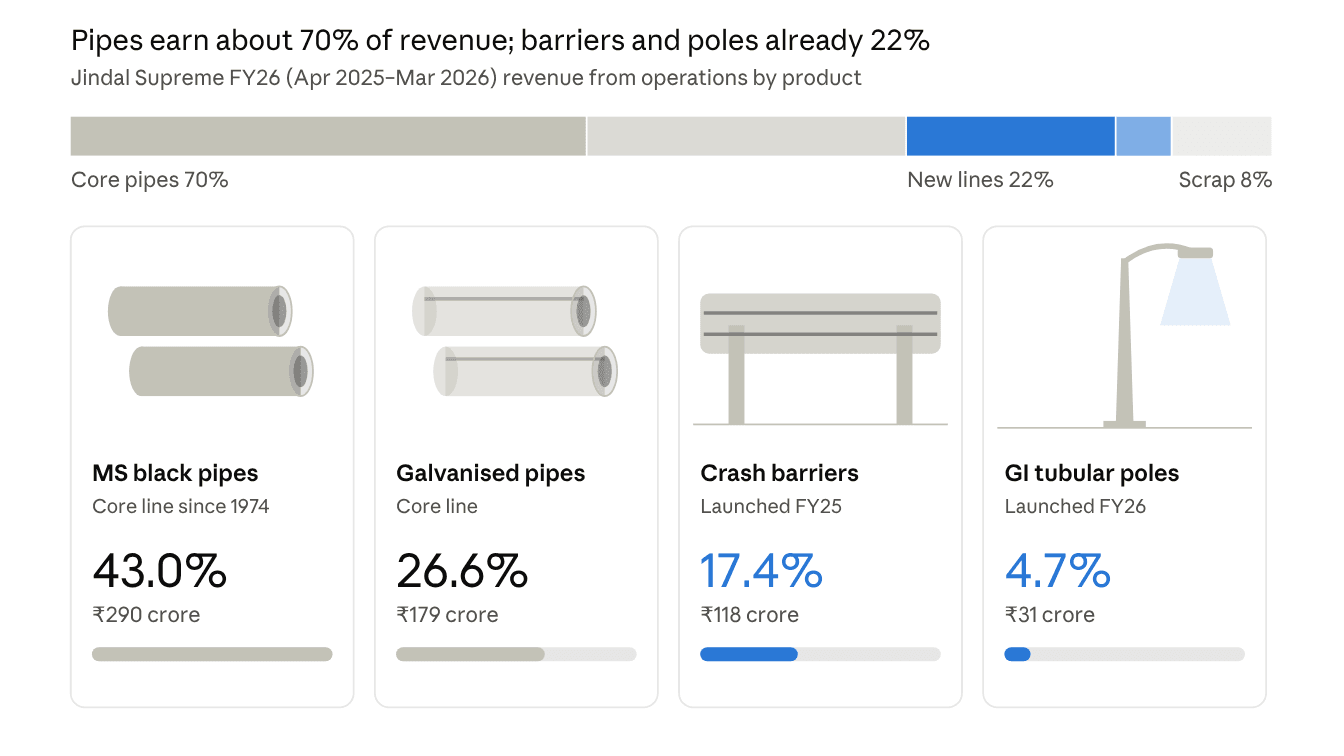
Illustrations are schematic, not product photographs.
| Product | Installed capacity (MTPA) | FY26 utilisation |
|---|---|---|
| MS black pipes and tubes | 90,000 | 65.2% |
| Galvanised pipes and tubes | 45,000 (63,000 after 2026 upgrade) | 60.3% |
| Metal beam crash barriers | 24,000 (42,000 after 2026 upgrade) | 65.2% |
| GI tubular poles | 12,000 | 33.5% |
| Total | 171,000 | — |
FY = April–March.
The practitioner's read: with utilisation at 60–65% and ₹7.19 crore already spent from internal accruals to lift crash-barrier and galvanising capacity, the next two years of growth need little fresh capex. That is the main reason the IPO money goes to debt, not machinery.
How has Jindal Supreme performed financially?
Jindal Supreme's earnings power has roughly doubled in two years on almost unchanged revenue. FY26 EBITDA was ₹41.63 crore against ₹21.11 crore in FY24, on revenue of ₹675.4 crore versus ₹645.4 crore. Q1 FY27 (Apr–Jun 2026) extended the trend: PAT rose 31% YoY to ₹8.28 crore on 11.4% higher sales.
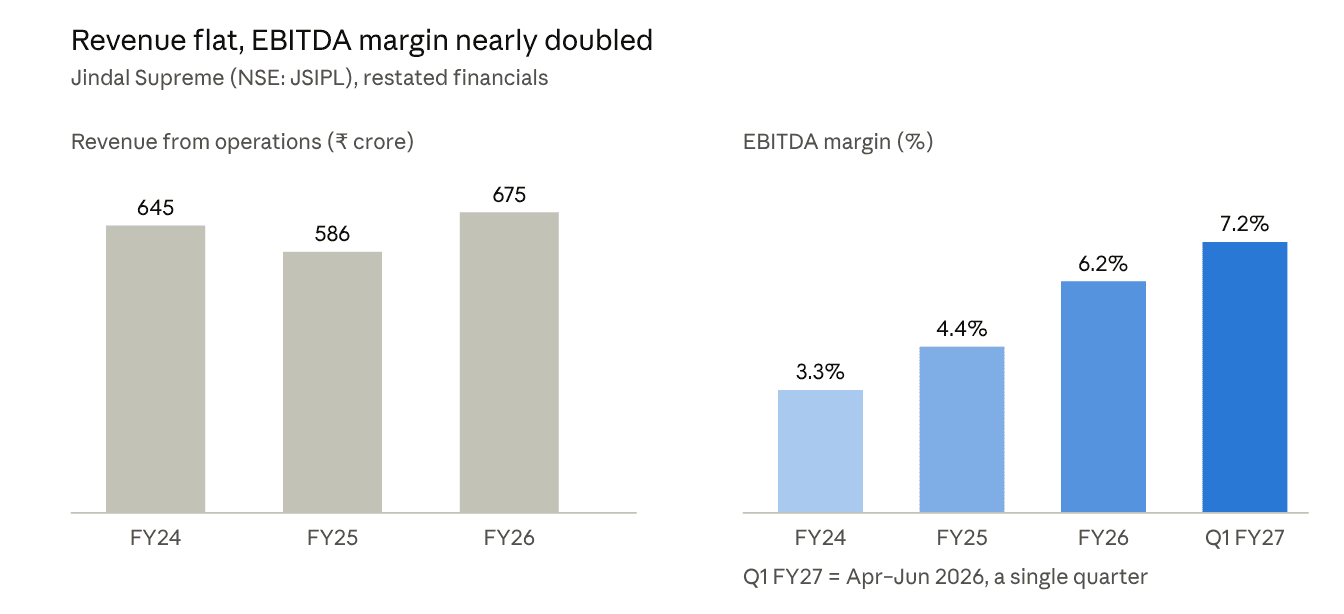
Reported FY26 PAT fell 7% to ₹22.53 crore, but that is optical. FY25 PAT of ₹24.27 crore included a one-off ₹16.60 crore gain on an asset sale; FY25 PBT (₹32.39 crore) exceeded EBITDA (₹25.92 crore) for that reason.
| Metric (₹ crore unless stated) | FY24 | FY25 | FY26 | Q1 FY27 |
|---|---|---|---|---|
| Revenue from operations | 645.44 | 586.40 | 675.39 | 190.94 |
| EBITDA | 21.11 | 25.92 | 41.63 | 13.76 |
| PAT | 12.87 | 24.27 (incl. one-off gain) | 22.53 | 8.28 |
| PAT margin | 1.99% | 4.14% | 3.34% | 4.33% |
| Sales volume (tonnes) | — | 96,400 | 101,100 | — |
| Net worth | 50.31 | 74.64 | 96.82 | 105.02 |
| Total borrowing | 104.92 | 95.84 | 119.87 | 92.46 |
| Debt / equity | 2.09x | 1.28x | 1.24x | 0.88x |
| ROE | — | — | 26.3% | 8.2% (quarter, not annualised) |
Is the margin gain structural or cyclical?
It is both, and investors should not extrapolate all of it. Raw material cost fell from 90.25% to 85.60% of revenue between FY24 and FY26, which partly reflects softer steel prices. The structural part is mix: crash barriers and poles went from zero to 22% of sales in two years.
What did the IPO change for Jindal Supreme?
The ₹124.88 crore IPO (16–18 Sep 2026) turned a leveraged mill into a near-debt-free one. It was a ₹99.89 crore fresh issue plus a ₹24.99 crore offer for sale by promoter-group entity VVJ Enterprise, priced at ₹93 and subscribed over 177 times.
Of the fresh money, ₹71.00 crore repays borrowings and ₹16.85 crore goes to general corporate purposes; total issue costs are ₹15.05 crore. Below is our rebuild of the balance sheet; the post-IPO column is our estimate, not a reported figure.
| Item | Pre-IPO (30 Jun 2026) | Post-IPO (our estimate) |
|---|---|---|
| Shares outstanding | 4.03 crore | 5.10 crore |
| Promoter holding | 100% | 73.68% |
| Total borrowing | ₹92.46 crore | ~₹21 crore |
| Net worth | ₹105.02 crore | ~₹193 crore |
| Debt / equity | 0.88x | ~0.11x |
| Book value per share | ₹26.07 | ~₹37.8 |
Post-IPO net worth assumes the fresh issue less its share of issue costs is added to June 2026 net worth.
How does Jindal Supreme compare with its peers?
Jindal Supreme is priced in the middle of the listed steel-pipe pack: richer than the volume players, cheaper than the brand and integration leaders. We compare it with the three peers its RHP names (Hi-Tech Pipes, Sambhv Steel Tubes, Vibhor Steel Tubes) plus sector leader APL Apollo Tubes as the valuation ceiling.
Operating comparison
On margin and returns, Jindal Supreme beats the two closest peers by size and loses to the two leaders. Its 6.16% FY26 EBITDA margin is 1.6x Vibhor's and 1.5x Hi-Tech's.
| Company (NSE) | FY26 revenue (₹ crore) | FY26 revenue growth | FY26 EBITDA margin | EBITDA per tonne (₹) | ROE | Debt / equity |
|---|---|---|---|---|---|---|
| Jindal Supreme (JSIPL) | 675 | 15.2% | 6.16% | 4,118 (FY26) | 12.7% post-IPO (26.3% pre-IPO) | ~0.11x post-IPO |
| APL Apollo Tubes (APLAPOLLO) | 23,080 | ~12% | 7.8% | 5,161 (FY26) | ~22% | Net cash ₹1,400 crore |
| Hi-Tech Pipes (HITECH) | 4,200 | 36.9% | 4.13% | 3,162 (Q1 FY27) | 5.7% | 0.02x |
| Sambhv Steel Tubes (SAMBHV) | 2,413 | 59.7% | 11.45% | 9,355 (Q1 FY27, incl. sponge iron) | 16.5% | 0.04x |
| Vibhor Steel Tubes (VSTL) | 1,149 | 15.4% | 3.78% | Not disclosed | 4.6% | 0.01x |
ROE for Hi-Tech, Sambhv and Vibhor is trailing, per Value Research and Fyers.
Valuation comparison
On price, the market already pays Jindal Supreme a premium to the commodity peers. Its 1.02x market cap to sales is five times Vibhor's, which is fair given roughly three times the ROE, but it leaves little room for a margin slip.
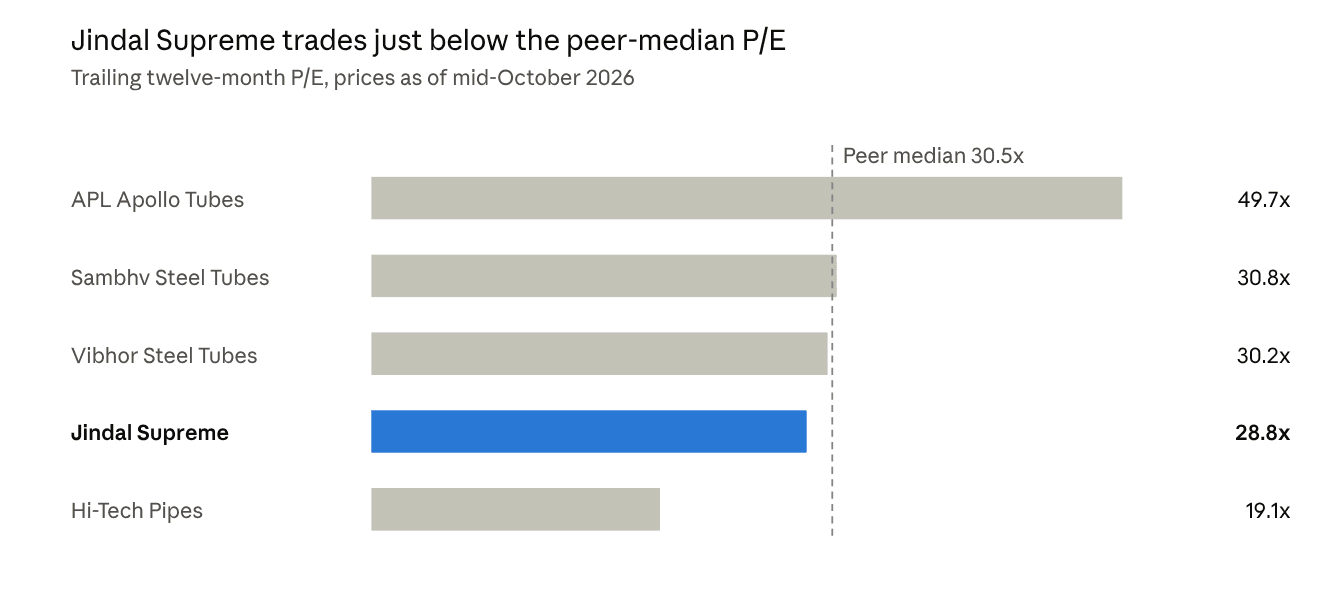
Jindal Supreme: our calculation at ₹138.40 (23 Oct 2026) on TTM PAT of ₹24.51 crore; peers as of 12–16 Oct 2026.
| Company | Market cap (₹ crore) | Price / book | Market cap / TTM sales | Market cap / FY26 EBITDA |
|---|---|---|---|---|
| Jindal Supreme | 706 | 3.7x (post-IPO book) | 1.02x | 17.0x |
| APL Apollo Tubes | 61,029 | 10.9x | 2.67x | 33.9x |
| Sambhv Steel Tubes | 5,077 | ~5.1x (derived) | 1.96x | 18.4x |
| Hi-Tech Pipes | 1,438 | 1.1x | 0.30x | 8.3x |
| Vibhor Steel Tubes | 229 | 1.0x | 0.19x | 5.3x |
Sambhv P/B derived from market cap and trailing ROE. Market cap / EBITDA is used instead of EV/EBITDA because peer net debt is not uniformly disclosed; on a true EV basis Jindal Supreme is 16.4x TTM EBITDA.
What the peer table tells us
The pattern is clear: the market pays for margin and return on equity, not for tonnes. Hi-Tech and Vibhor sell more steel per rupee of market value, but at 4% margins they earn too little for a premium.
Jindal Supreme's sales multiple of about 1x sits where its 6–7% margin would place it on that line, between Hi-Tech and Sambhv. The stock is not mispriced on current numbers. The upside case rests on two things the trailing P/E ignores: interest savings from the debt paydown and utilisation rising from 60–65%.
On our FY27 and FY28 estimates (next section), the P/E falls to 20.6x and 16.8x. The FY28 figure is below every peer's trailing multiple, Hi-Tech's included. That gap, not the trailing multiple, is the investment debate.
What is Jindal Supreme's fair value?
Our probability-weighted fair value is about ₹161 per share, built on FY28 (Apr 2027–Mar 2028) earnings. That is roughly 16% above ₹138.40, a moderate rather than compelling gap for a single-plant small cap.
Our model assumptions
We assume 14% annual revenue growth (Q1 FY27 grew 11.4%, and utilisation is only 60–65%), margins edging up to 7%, and interest falling to near zero after the ₹71 crore repayment. Tax is 25.2% and EPS uses 5.10 crore post-IPO shares.
| ₹ crore unless stated | FY26 (actual) | FY27E | FY28E |
|---|---|---|---|
| Revenue | 675.4 | 770 | 875 |
| EBITDA margin | 6.16% | 6.8% | 7.0% |
| EBITDA | 41.6 | 52.4 | 61.3 |
| Interest | ~8 (est.) | 4.0 | 2.0 |
| PAT | 22.5 | 34.3 | 42.1 |
| EPS (₹) | 4.42 | 6.72 | 8.25 |
| P/E at ₹138.40 | 31.3x | 20.6x | 16.8x |
FY26 actuals from the RHP. These are our assumptions, not company guidance; the company has not issued guidance.
Bear, base and bull scenarios
The range is wide because a 2-point swing in margin moves FY28E EPS by about a third for a company this size.
| Scenario | Probability | FY28E revenue (₹ crore) | EBITDA margin | FY28E EPS (₹) | Exit P/E | Value per share | vs ₹138.40 |
|---|---|---|---|---|---|---|---|
| Bear: steel spreads compress, tenders slow | 25% | 760 | 5.0% | 4.84 | 14x | ₹68 | −51% |
| Base: steady utilisation gains | 50% | 875 | 7.0% | 8.25 | 20x | ₹165 | +19% |
| Bull: barriers and poles scale, 80%+ utilisation | 25% | 960 | 7.8% | 10.24 | 24x | ₹246 | +78% |
| Probability-weighted | ₹161 | +16% |
Our analyst view (educational, not a recommendation)
Jindal Supreme passes our first screen: positive operating leverage, a de-leveraged balance sheet and a reasonable forward multiple. It fails the multi-bagger screen at today's price, because doubling needs the bull case plus a re-rating.
In our framework the risk-reward improves materially below ₹120, the listing price, where the stock would trade near 14.5x FY28E EPS. For readers already holding IPO allotments at ₹93, the business case is intact; the debate is valuation, not quality.
What are the key risks for Jindal Supreme?
The biggest risk is concentration: one plant, one region and one raw material. Any of the five below could push the stock toward our bear case.
| Risk | Evidence (FY26 unless stated) | What would confirm it |
|---|---|---|
| Raw material spreads | Steel coil and zinc were 93.2% of operating expenses (₹601.95 crore) | EBITDA margin back below 5% in a quarter of rising HRC prices |
| Single plant | All output from one 16-acre Hisar site; RHP flags no business-interruption insurance | Any unplanned shutdown or fire disclosure |
| Working capital and cash conversion | ₹131.47 crore tied up; operating cash flow −₹5.69 crore | Negative OCF again in H1 FY27 despite the debt paydown |
| Regional and dealer dependence | Top 10 states 96.8% of sales; 53 dealers with no long-term contracts | Haryana share falling without new states replacing it |
| Supply overhang and governance | Remaining anchor shares unlock 19 Dec 2026; a director/KMP exit within a week of listing | Price weakness into December; further senior exits |
Supplier concentration adds to this: the top 10 suppliers provided 76.2% of FY26 purchases. For a converter with a 6% margin, a single supplier dispute can matter more than a demand slowdown.
What should investors watch next?
The first listed-company results, for Q2 FY27 (Jul–Sep 2026), are the next test; under SEBI's 45-day rule they are due by 14 Nov 2026, and the board-meeting date has not yet been announced. The company closed its trading window from 1 Oct 2026 ahead of them.
| Checkpoint | Expected timing | What would support the base case |
|---|---|---|
| Q2 FY27 results and first half-year cash-flow statement | By 14 Nov 2026 | EBITDA margin at or above 6.5%; positive H1 operating cash flow |
| Debt repayment from IPO proceeds | Q3 FY27 (Oct–Dec 2026), our expectation | Finance cost falling toward ₹1 crore a quarter |
| Remaining 50% anchor unlock | 19 Dec 2026 | Unlock absorbed without a break below the ₹120 listing price |
| Ramp-up of 42,000 MTPA crash-barrier and 63,000 MTPA galvanising capacity | FY27 | Crash barriers and poles above 25% of revenue |
| Q3 FY27 results | By mid-Feb 2027 | Nine-month revenue growth of 12%+ year on year |
The structural backdrop is supportive. Highway safety norms, street-lighting and rural electrification spending all pull on crash barriers and GI poles, the two lines where Jindal Supreme is adding capacity. The question is whether a ₹700 crore company can win share in tender-driven markets where Hi-Tech Pipes, Vibhor and other established makers also bid.
Frequently asked questions
What is the P/E ratio of Jindal Supreme?
At ₹138.40 (23 Oct 2026), Jindal Supreme trades at about 28.8x trailing twelve-month earnings of ₹24.51 crore, using 5.10 crore post-IPO shares. On FY26 earnings alone it is 31.3x. Many websites show the P/E as zero or blank because the stock has not yet reported a full listed year.
Who are Jindal Supreme's competitors?
Its RHP names Hi-Tech Pipes, Sambhv Steel Tubes and Vibhor Steel Tubes as listed peers. APL Apollo Tubes, India's largest structural steel tube maker, is the sector benchmark. Vibhor is the closest like-for-like peer, also Hisar-based and also making ERW pipes, galvanised pipes and crash barriers.
Why did Jindal Supreme shares fall after listing?
The stock listed at ₹120, peaked at ₹214.96 and fell to ₹138.40 by 23 Oct 2026. The fade coincided with the 30-day anchor lock-in expiry on 20 Oct 2026 and a director/KMP resignation on 29 Sep 2026. No fundamental data has changed since the Q1 FY27 numbers in the prospectus.
Is Jindal Supreme a good stock to buy?
We do not make buy or sell calls. Our analysis finds improving margins and a near-debt-free balance sheet after the IPO, but a valuation already in line with peers. Our probability-weighted fair value is about ₹161; readers should consult a SEBI-registered adviser before investing.
When will Jindal Supreme announce Q2 FY27 results?
The board-meeting date has not been announced as of 25 Oct 2026. Under SEBI's listing rules, results for the quarter ended 30 Sep 2026 must be published within 45 days, that is by 14 Nov 2026.
Is Jindal Supreme part of the Jindal Steel group?
Jindal Supreme was founded in 1974 as Janak Steel Tubes by the late Madan Lal Jindal and is promoted by Abhishek and Sonam Jindal. It is a separate, small Hisar-based company and should not be confused with Jindal Steel, Jindal Saw or JSW Steel.
Conclusion
Our Jindal Supreme share analysis finds a business that has genuinely improved: EBITDA margin up from 3.3% in FY24 to 7.2% in Q1 FY27 and debt set to fall by three-quarters. At 28.8x trailing and 16.8x FY28E earnings, the price already credits much of that, leaving a fair value near ₹161 and a better entry below ₹120.
For how we weigh similar post-IPO stories, see our Xtranet Technologies IPO analysis and the Indian steel and metals sector hub.
Related research: Sambhv Steel Tubes share analysis
Sources
- Jindal Supreme (India) Ltd Red Herring Prospectus, SEBI
- JSIPL quote and filings, NSE
- Jindal Supreme IPO details, restated financials and KPIs, Chittorgarh
- Jindal Supreme IPO segment, customer and peer data, INDmoney
- Jindal Supreme capacity and utilisation, Alice Blue IPO review
- Jindal Supreme Q1 FY27 standalone results, JM Financial (Capital Market feed)
- APL Apollo Tubes FY26 results press release
- Hi-Tech Pipes Q1 FY27 investor presentation, NSE
- Hi-Tech Pipes peer comparison, Value Research (16 Oct 2026)
- Sambhv Steel Tubes Q1 FY27 analysis, multibagg.ai
- Vibhor Steel Tubes results and valuation, Fyers
This report is for information only and is not an offer or solicitation to buy or sell any security; views and estimates are as of the date of publication and may change without notice. Investments in securities market are subject to market risks; read all the related documents carefully before investing.