GE Vernova T&D India share analysis: ₹33,500 crore order book, zero debt, 80x P/E — India's HVDC champion or priced for perfection?
This GE Vernova T&D India share analysis starts with one number: the stock trades near ₹4,194 (9 Oct 2026), about 26% below its June 2026 high of ₹5,650, yet still at roughly 80x trailing earnings. GE Vernova T&D India Ltd (NSE: GVT&D) has turned from a loss-maker in FY22 into one of India's most profitable grid-equipment companies. In this report we read the FY26 annual report and the last two earnings calls line by line. We cover the order book, the new ₹13,000 crore HVDC win, the balance sheet, cash flows, peers, sector growth, and whether investors should track or ignore the stock.
- FY26 revenue rose 45% to ₹6,206 crore and net profit doubled to ₹1,233 crore; EBITDA margin expanded from 19.1% to 27.1%.
- Order backlog was ₹20,930 crore on 30 Jun 2026; adding the Barmer–South Kalamb HVDC order (~₹12,500–13,000 crore, L1 on 7 Sep 2026) takes it to roughly ₹33,500 crore, about 5x FY26 revenue.
- The company is debt-free with ₹2,930 crore cash (including ₹971 crore lent to a GE group cash pool) and generated ₹1,710 crore of operating cash in FY26, 139% of net profit.
- Growth is slowing at the profit line: Q1 FY27 PAT grew 25% against 100%+ in FY26, as gross margin fell 7 points year on year.
- At ~72x FY27E and ~58x FY28E earnings (our estimates), the business quality is priced in; our probability-weighted value implies only ~10% upside over 18 months.
What is happening with the GE Vernova T&D India share right now?
The stock is in a consolidation phase: it has fallen about 26% from its all-time high of ₹5,650 (23 Jun 2026) to ₹4,194 (9 Oct 2026), even though the business keeps winning orders. The fall is about valuation and sentiment, not a collapse in fundamentals.
Three things knocked the stock off its peak. First, on 24 Jun 2026 the Finance Ministry allowed four China-linked equipment makers to bid in select critical power tenders for two years; GE Vernova T&D fell 7.8% intraday on the news. Second, Q1 FY27 results (7 Aug 2026) showed order intake down 30% YoY and gross margin down 7.1 points. Third, the stock was simply expensive at over 110x trailing FY26 earnings at the peak.
The Barmer HVDC win on 7 Sep 2026 lifted the shares ~9% in a day to ₹4,755, but the gain faded within a month. That tells us the market already expected large HVDC wins and is now waiting for proof of earnings growth.
Ownership is concentrated and institutional. The GE Vernova group holds 51.0%, FPIs 22.9% and domestic institutions 18.5% (June 2026). Retail holds only about 7.7%, so the stock moves on institutional flows and broker estimate changes.
At ₹4,194 the company is valued at ₹1,07,398 crore, about 80x trailing earnings and 40x book, with a 0.24% dividend yield. The 52-week range is ₹2,525–5,650.
What does GE Vernova T&D India do?
GE Vernova T&D India is the listed Indian arm of GE Vernova's Electrification segment, making high-voltage equipment and building substations and HVDC links that move power from plants to cities. It has 65+ years in India, 1,851 permanent employees and five factories.
The parent, GE Vernova Inc (US), holds 51% through Grid Equipments Pvt Ltd and GE Grid Alliance BV. That parentage gives the Indian company global technology, access to group export orders, and the GE brand. It costs about 3% of revenue in royalty, trademark and HQ charges (₹190 crore in FY26 vs ₹140 crore in FY25).
Its products span power transformers and reactors (Vadodara), gas- and air-insulated switchgear, circuit breakers and instrument transformers (Padappai and Hosur), grid automation and protection (Pallavaram), HVDC and STATCOM systems, GridOS software (Noida), and turnkey substations and services.
How revenue is earned: in FY26, 69% came from long-term project contracts recognised over time (₹4,290 crore), 30% from product sales (₹1,855 crore) and about 1% from services. By geography, 67% was domestic (₹4,173 crore) and 33% exports (₹2,033 crore, to 60+ countries). Exports nearly doubled from ₹1,112 crore in FY25.
The customer mix has changed sharply. Private developers now make up 77% of the backlog, central utilities and PSUs 21%, and cash-strapped state utilities only 2%. Ten years ago, state utilities were the company's biggest working-capital headache.
What is GE Vernova T&D's current order book?
The reported order backlog is ₹20,930 crore as of 30 Jun 2026, about 3.1x trailing revenue. Including the Barmer–South Kalamb HVDC order (L1 on 7 Sep 2026, value not disclosed; press and broker estimates put it at ₹12,500–13,000 crore), the pro-forma backlog is roughly ₹33,500 crore, or ~5x FY26 revenue. Very few Indian capital-goods companies carry that much visibility.
| Period | Order inflow (₹ crore) | YoY | Closing backlog (₹ crore) |
|---|---|---|---|
| FY25 (Apr 2024–Mar 2025) | ~10,700 | — | 14,380 |
| FY26 (Apr 2025–Mar 2026) | 14,776 | +37% | 21,460 |
| Q4 FY26 (Jan–Mar 2026) | 8,610 | +188% | 21,460 |
| Q1 FY27 (Apr–Jun 2026) | 1,137 | -30% | 20,930 |
| Pro-forma incl. Barmer HVDC (est.) | +12,500 to 13,000 | — | ~33,500 |
Pro-forma is Copernicus estimate.
What is inside the backlog?
The backlog now has three HVDC projects, which changes the revenue shape. HVDC jobs spend the first two years on engineering and supply-chain set-up, so management says meaningful HVDC revenue starts only from FY29.
- Khavda–South Olpad (Adani Energy Solutions), 2,500 MW VSC HVDC — booked in Q4 FY26. India's second-ever VSC link and the company's first VSC project.
- Power Grid LCC HVDC refurbishment — won December 2025; replacing valves and controls on a 20–25-year-old link.
- Barmer II–South Kalamb, 6,000 MW ±800 kV LCC terminal — L1 in September 2026; Hitachi Energy was the main rival. Total project cost is ~₹24,970 crore (NCT-approved).
- Exports are only 10–15% of the backlog today, versus 33% of FY26 revenue, so the very profitable export share of sales is likely to shrink in FY27.
Why did Q1 FY27 orders fall 30%?
Domestic TBCB (tariff-based competitive bidding) awards were thin in January–March 2026, and developers place equipment orders 1–3 months after winning. Management also called Q4 domestic booking "a conscious decision" to protect margins. The good news: 46% of Q1 orders were exports, including CTs/CVTs for a GE Vernova entity in North America and 400 kV GIS for group entities in Spain and Morocco.
Management still guides for ₹7,000–8,000 crore of base (non-HVDC) orders a year and says the TBCB pipeline improved from June 2026, with 33 packages under bid as of May 2026, 21 of them at 765 kV.
Latest corporate events and news
- 9 Sep 2026 – AGM: ₹10/share FY26 dividend (~₹256 crore, ~21% payout) approved.
- Pending export orders: a ₹1,300 crore US data-centre order via the GE group is now expected in Q2–Q3 FY27; a separate ₹3,000 crore export project is on hold for customer budget reasons (approval lapsed at the AGM).
- 18 May 2026 – Vallam plant: ₹55 crore for disconnectors and drives; part capacity from Q1 2027.
- FY26 one-off: ₹63.6 crore exceptional charge for new Wage Code gratuity, excluded from operating margin.
How fast will India's power transmission sector grow in the next three years?
India's transmission spend is set to run at roughly ₹0.8–1.0 lakh crore a year: ICRA expects ₹5–6 trillion of transmission capex between FY27 and FY32 (July 2026). We estimate the domestic high-voltage equipment market grows at 12–15% a year over FY26–FY29, with HVDC awards adding lumpy upside on top.
The driver is simple: generation is being built faster than the wires to carry it. As of May 2026, only about 33% of 54.8 GW of newly commissioned renewable capacity could be evacuated through the temporary T-GNA route, with 50–60% curtailment during solar hours in Rajasthan and Gujarat (ICRA). Every stranded megawatt is pressure on the government to award more lines, substations and HVDC corridors.
| Indicator | Latest | Target / outlook | Source |
|---|---|---|---|
| Installed capacity | 532.7 GW (Mar 2026) | ~800 GW by 2030 | CEA via annual report |
| Non-fossil capacity | 283.5 GW (Mar 2026) | 500 GW by 2030; ~786 GW by 2035–36 | MNRE / CEA |
| Peak demand | 245.4 GW (FY26) | 366 GW by 2030; ~459 GW by 2035–36 | CEA |
| Transmission network | 5 lakh+ ckm | +20,000 ckm and +120 GVA a year needed | NEP-II / ICRA |
| Transformation capacity added (220 kV+) | 113 GVA in FY26 | ~120 GVA a year | Annual report MD&A |
| HVDC capacity | ~33.5 GW installed | +33 GW by 2032; ~10 new 6 GW links from Rajasthan by 2035–36 | NEP (Transmission) |
| Transmission projects under bid or execution | ~₹5 trillion | ₹7.9 trillion investment by 2036 | CEA |
| Transmission capex | — | ₹5–6 trillion, FY27–FY32 | ICRA, Jul 2026 |
| Data-centre load | ~1.4 GW installed | ~8 GW by 2030 | Annual report MD&A |
Near-term growth stories to watch (FY27–FY29)
- HVDC corridors. Brokers expect one to two HVDC awards a year. Each 6 GW LCC terminal is worth ₹8,000–13,000 crore to the equipment supplier. Only three companies in India can execute them: GE Vernova T&D, Hitachi Energy and Siemens Energy.
- 765 kV AC build-out. 21 of the 33 TBCB packages under bid in May 2026 were 765 kV, the voltage where GE Vernova has the deepest installed base.
- Grid stability (STATCOM, synchronous condensers). Grid disturbances at Khavda in May–June 2026 pushed urgency on STATCOM tenders; CEA recommends STATCOMs at all new 400/765 kV renewable substations.
- Data centres. Small today, but 400 kV and 765 kV hyperscale campuses would need GIS and transformers at better realisations than utility orders.
- Exports. US, European and Middle East grid upgrades face a global equipment shortage. India-made products for GE group entities are a growing outlet.
What the sector numbers do not tell you
The cycle is real, but it is not smooth. Management expects the domestic TBCB market to be flat to +6–7% in FY27, not double-digit. Only 12% of TBCB projects commissioned by March 2026 were on time (ICRA), and Power Grid has stretched project timelines from 18–24 months to 24–30 months, which delays equipment ordering by a quarter or so. Capacity is also being added across the industry; management admits domestic demand alone would leave the industry in oversupply after 2–3 years if exports do not absorb the extra capacity.
Financial health: P&L, balance sheet and cash flow
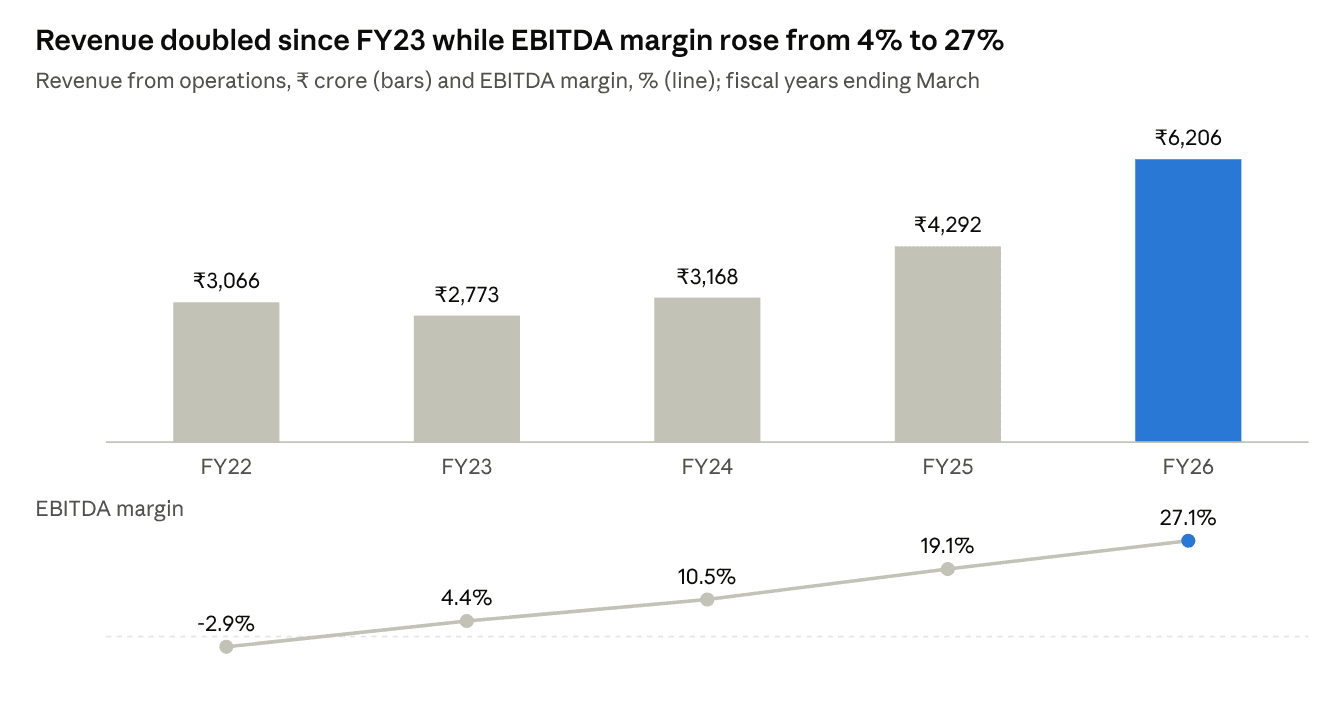
GE Vernova T&D India is in its strongest financial shape in a decade: revenue has more than doubled since FY23, EBITDA margin has gone from low single digits to 27%, the company carries zero debt, and operating cash flow exceeds net profit. The open question is not quality; it is how much more margin is left.
Five-year trend: a full turnaround
Between FY22 and FY26, revenue grew from ₹3,066 crore to ₹6,206 crore (19% CAGR; 31% CAGR from the FY23 low), while net profit swung from a ₹50 crore loss to a ₹1,233 crore profit. The turnaround came from exiting low-priced legacy contracts, cutting state-utility exposure, lean manufacturing, and a richer export mix.
Profit and loss: FY26 and Q1 FY27
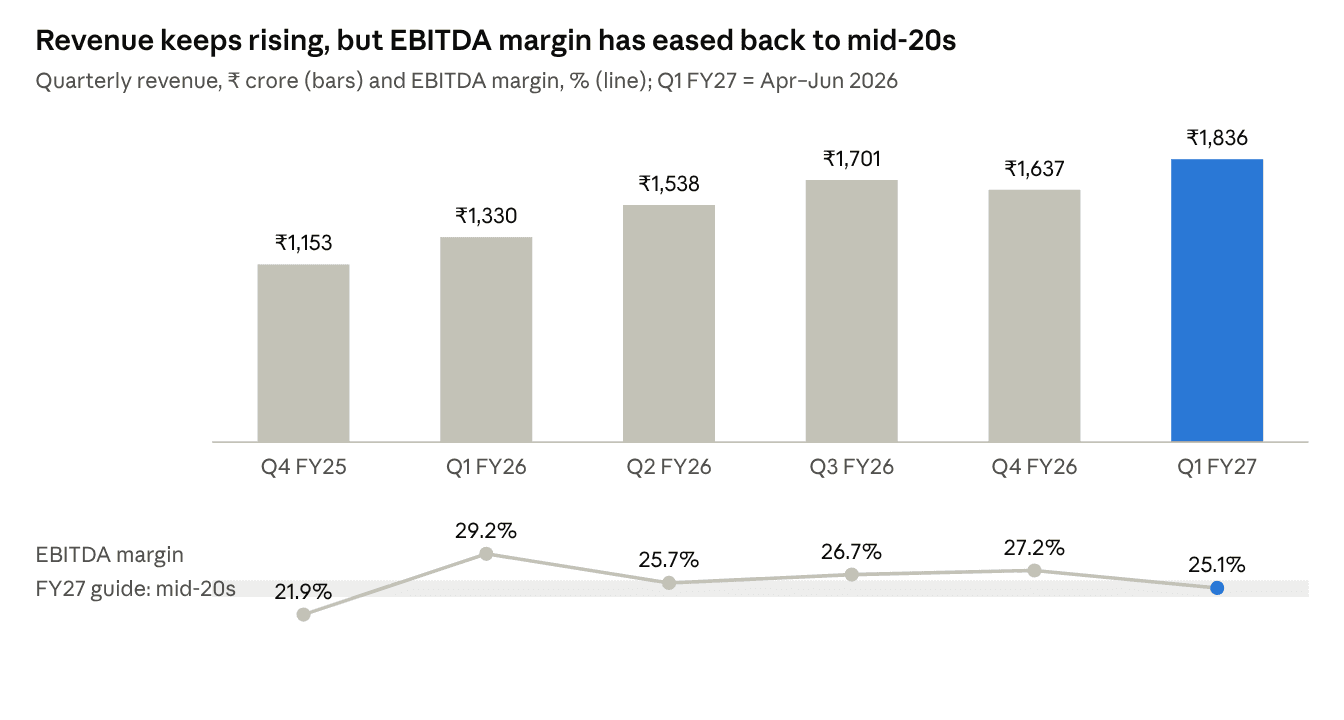
FY26 was a year of strong positive operating leverage: revenue rose 45% but EBITDA rose 106%. Q1 FY27 shows the first sign of normalisation, with gross margin down 7.1 points YoY even as revenue grew 38%.
| ₹ crore | FY25 | FY26 | YoY | Q1 FY26 (Apr–Jun 2025) | Q1 FY27 (Apr–Jun 2026) | YoY |
|---|---|---|---|---|---|---|
| Revenue from operations | 4,292 | 6,206 | +45% | 1,330 | 1,836 | +38% |
| Gross margin | 40.4% | 45.3% | +4.9 pts | 48.4% | 41.3% | -7.1 pts |
| Employee cost / revenue | 9.3% | 7.2% | -2.1 pts | — | — | — |
| Other expenses / revenue | 12.0% | 10.9% | -1.1 pts | — | — | — |
| EBITDA | 819 | 1,684 | +106% | 388 | 461 | +19% |
| EBITDA margin | 19.1% | 27.1% | +8.0 pts | 29.2% | 25.1% | -4.1 pts |
| Other income | 63 | 91 | +45% | — | — | — |
| PBT before exceptional items | 820 | 1,713 | +109% | ~390 | ~490 | +26% |
| Net profit (PAT) | 608 | 1,233 | +103% | 291 | 363 | +25% |
| EPS (₹) | 23.76 | 48.16 | +103% | 11.37 | 14.18 | +25% |
EBITDA computed as PBT before exceptional items + finance cost + depreciation – other income.
Why gross margin fell in Q1 FY27 (CFO's bridge, vs FY26 average of 45.3%):
- 2–2.5 points from ramping up a lower-gross-margin part of the HV business; mostly recovered at EBITDA through operating leverage.
- 1–1.5 points from a lower export share (30% of revenue vs 33%) and the absence of one very profitable FY26 export order.
- The rest from elevated commodity prices (copper, CRGO steel) eating into expected execution savings. Transformers carry IEEMA price-variation clauses; switchgear and turnkey jobs do not.
Management guides "mid-20s" EBITDA margin for FY27, below the 27.1% achieved in FY26. In other words, the company itself is telling investors that margins have peaked for now.
Balance sheet: debt-free, cash-rich, negative working capital
The balance sheet is the strongest part of the story. Shareholders' equity rose 52% to ₹2,690 crore, there are no borrowings, and customers are effectively funding the business through advances.
| ₹ crore (31 March) | FY25 | FY26 | Change |
|---|---|---|---|
| Fixed assets incl. CWIP and right-of-use | 427 | 477 | +12% |
| Inventories | 704 | 1,228 | +74% |
| Trade receivables | 1,469 | 2,172 | +48% |
| Contract assets | 328 | 372 | +13% |
| Cash and bank balances | 473 | 1,528 | +223% |
| Inter-corporate deposit to GE group cash pool | 578 | 971 | +68% |
| Total assets | 4,661 | 7,739 | +66% |
| Shareholders' equity | 1,773 | 2,690 | +52% |
| Borrowings | 0 | 0 | — |
| Trade payables | 1,026 | 1,580 | +54% |
| Advances from customers | 305 | 1,270 | +317% |
| Deferred income (billing ahead of revenue) | 787 | 1,099 | +40% |
| Provisions (warranty, employee, litigation) | 508 | 557 | +10% |
| Net working capital excl. cash | -168 | -871 | — |
Key ratios for FY26: receivable days 128 (125 in FY25), inventory days 72 (60), payable days 93 (87), current ratio 1.3x, debt-to-equity zero, ROE ~57% and pre-tax ROCE ~77%.
Three observations that most summaries miss:
- Working capital is negative because of advances, not tighter collections. Receivable days actually rose slightly (125 to 128). The swing came from a ₹965 crore jump in customer advances, mostly HVDC mobilisation money. As those advances are consumed over FY27–FY29, reported cash flow will look weaker even if the business is fine.
- Inventory is building ahead of execution. Inventory rose 74% against revenue growth of 45%, consistent with the large backlog and longer HVDC supply chains.
- About 39% of liquid funds sit with a group company. ₹971 crore is lent on demand to LM Wind Power Blades (India) under a GE group cash pool. It is guaranteed by GE Vernova Inc since 29 Sep 2025 and earns interest, but minority shareholders should watch this balance.
One more line worth noting: other comprehensive income included a ₹245 crore pre-tax loss on forex derivatives used to hedge export contracts. It does not hit reported PAT, but it shows how much currency exposure sits in the export book.
Cash flow: profits are converting to cash
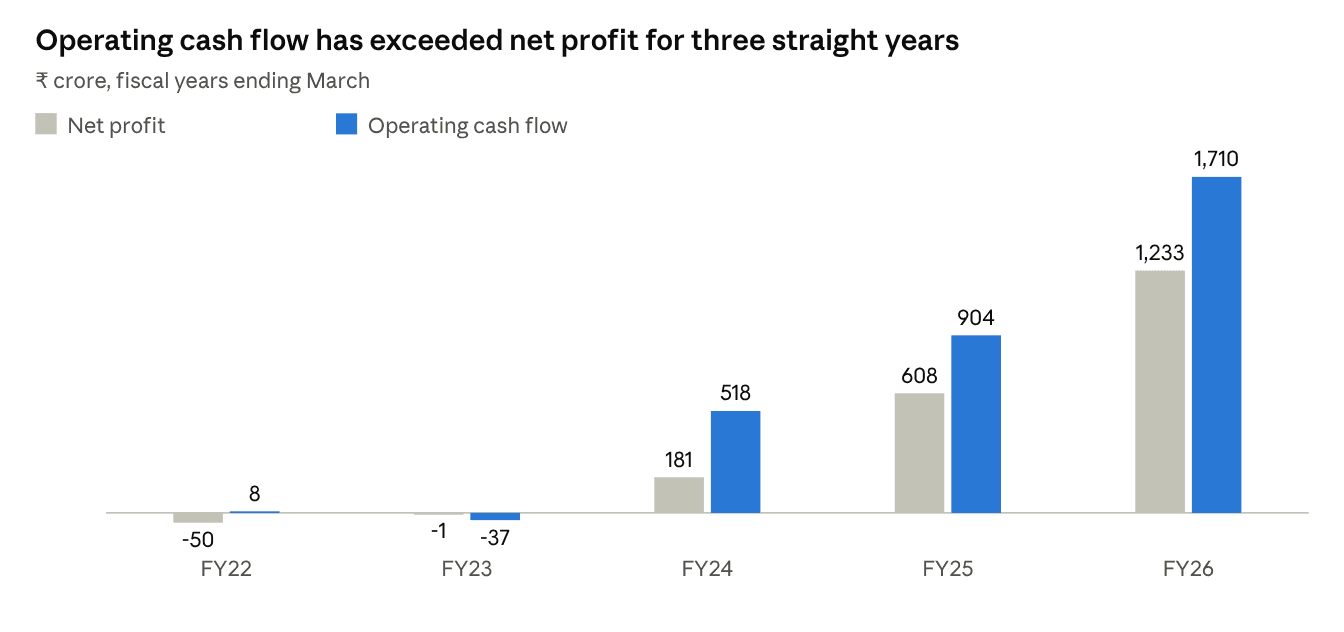
Cash conversion is excellent. Operating cash flow was ₹1,710 crore in FY26 (139% of PAT) and free cash flow after capex was ₹1,521 crore. Q1 FY27 added another ₹430 crore, taking total cash, including the group cash pool, to ₹2,930 crore by June 2026.
| ₹ crore | FY25 | FY26 |
|---|---|---|
| Operating cash flow before working capital | 927 | 1,822 |
| Working capital release / (build) | +182 | +380 |
| Taxes paid | -205 | -492 |
| Cash flow from operations (CFO) | 904 | 1,710 |
| Capex | -87 | -188 |
| Free cash flow | 816 | 1,521 |
| Lent to group cash pool (net) | -436 | -393 |
| Interest received | 27 | 71 |
| Dividends paid | -51 | -128 |
| Net increase in cash | +339 | +1,052 |
What are GE Vernova T&D's capex plans and growth initiatives?
The company is spending over ₹1,000 crore between 2026 and 2028, roughly 1.8x FY26's ₹188 crore capex every year, entirely from internal cash. Most of it goes into existing plants on land bought decades ago, which keeps the return on new capital high.
The main pieces: ₹140 crore for an HVDC LCC valve and VSC STATCOM valve line in Chennai; ₹810 crore to lift Vadodara transformer and reactor capacity by 50%, expand GIS/AIS, CT and breaker capacity at Hosur and Padappai by ~25%, and add air-core reactor and bushing lines at Hosur; and ₹55 crore for the new Vallam disconnector plant. All projects run from 2026 to 2028.
Why these projects matter
- HVDC localisation is the moat. When the company won its first Indian HVDC jobs around 2012, tenders allowed only one-third of transformers to come from India. Today it can supply 100% of HVDC transformers locally, and the new Chennai valve line means converter valves and controls will also be made in India. That lowers cost and protects margins against imported competition.
- Capacity is the bottleneck, not demand. With a 5x revenue backlog, lead times decide who wins the next order. +50% transformer capacity directly lifts Vadodara's throughput.
- India for the World. Some new lines will act as global feeder factories for GE Vernova. Products from Indian plants already reach 60+ countries, and the parent's 100% acquisition of Prolec (US transformers) adds another channel for India-made components.
- Revenue is not tied one-to-one to capacity. HVDC projects include large bought-out content and manpower, so asset turnover rises sharply as HVDC execution starts in FY29.
What will the ₹1,680 crore of surplus cash be used for?
Of ₹2,930 crore of cash (June 2026), management has earmarked about ₹1,000 crore for capex and ₹250 crore for the dividend. That leaves ~₹1,680 crore unallocated. Management says options are "under evaluation" but nothing is firm. A larger dividend or buyback would support returns; parking more cash in the group cash pool would be a negative signal for minority shareholders.
On which parameters does GE Vernova T&D look attractive?
On business quality, GE Vernova T&D scores 74 out of 90 on our framework; on valuation it scores 2 out of 10. That gap, a top-tier business at a top-tier price, is the whole investment debate.
| Parameter | Weight | Score | Evidence |
|---|---|---|---|
| Order visibility | 15 | 14 | Backlog ~5x FY26 revenue incl. Barmer HVDC; three HVDC jobs locked in |
| Return ratios | 10 | 10 | ROE ~57%, pre-tax ROCE ~77%; negative working capital |
| Cash conversion | 10 | 9 | CFO 139% of PAT in FY26; FCF ₹1,521 crore |
| Competitive moat | 10 | 9 | One of three HVDC-capable players in India; 765 kV installed base; GE technology |
| Balance sheet | 10 | 8 | Zero debt, ₹2,930 crore cash; minus a point for the group cash-pool exposure |
| Revenue growth | 10 | 8 | +45% in FY26, +38% in Q1 FY27 |
| Customer quality | 5 | 5 | Private 77%, central/PSU 21%, state utilities 2% of backlog |
| Margin level and runway | 10 | 6 | 27.1% EBITDA in FY26 is best-in-class, but guidance is lower (mid-20s) |
| Profit growth momentum | 10 | 5 | PAT growth slowed from 103% (FY26) to 25% (Q1 FY27) |
| Valuation | 10 | 2 | ~72x FY27E and ~58x FY28E earnings; PEG near 3x |
| Total | 100 | 76 | Quality compounder, fully priced |
Scoring: Copernicus Hillview framework; data from annual report, earnings calls and market prices as of 9 Oct 2026.
The five strongest reasons to keep it on the radar
- Multi-year revenue is already contracted. Even with zero new orders, the backlog covers roughly four to five years of current revenue.
- HVDC is a three-player market. Every Rajasthan or Gujarat HVDC corridor is effectively a contest between GE Vernova, Hitachi Energy and Siemens Energy. Each win adds ₹8,000–13,000 crore.
- Capital efficiency is exceptional. Customers fund working capital, fixed assets are only ~8% of revenue, and new capacity goes on existing land.
- Profits are real cash. Three years of CFO above PAT removes the earnings-quality worry common in capital-goods stocks.
- The export option is free. A global equipment shortage and the parent's Prolec deal can lift export orders without new domestic tenders; exports earn 4–6 points higher margins than domestic orders, per management.
Are peers more attractive than GE Vernova T&D?
Yes, on growth-adjusted valuation, both listed peers look better placed today. GE Vernova T&D wins on margins, return ratios and cash. Hitachi Energy India and Siemens Energy India win on earnings momentum and remaining operating leverage, which is what drives the next leg of returns.
| Metric | GE Vernova T&D India | Hitachi Energy India | Siemens Energy India |
|---|---|---|---|
| Market cap, 9 Oct 2026 (₹ crore) | 1,07,398 | 1,36,414 | 1,10,433 |
| Trailing P/E | ~80x | ~115x | ~72x |
| ROE / ROCE | 57% / 77% | 22% / 29% | 51% / 68% |
| Latest-quarter margin | 25.1% EBITDA | 16.0% operational EBITDA | 21.9% EBIT |
| Order backlog, Jun 2026 (₹ crore) | 20,930 (~33,500 incl. Barmer) | 32,222 | 19,331 |
| Backlog growth (latest year) | +49% (Mar-25 14,380 → Mar-26 21,460) | +54% (Mar-25 ~19,255 → Mar-26 29,555) | +16% (Jun-25 16,601 → Jun-26 19,331) |
| Latest annual order inflow (₹ crore) | 14,776 (FY26) | 18,457 (FY26) | ~13,100 (FY25, Oct–Sep) |
| Backlog / TTM revenue | 3.1x (~5.0x incl. Barmer) | 3.5x | 2.0x |
| Revenue CAGR, FY24–FY26 | 40% | 25% | n.a. (listed Jun 2025); 9M FY26 +31% |
| PAT CAGR, FY24–FY26 | 161% | 145% | n.a.; 9M FY26 +52% |
| Latest-quarter revenue / PAT growth | +38% / +25% | +69% / +124% | +39% / +68% |
| Forward EPS CAGR (estimates) | ~24%, FY26–FY29E (Copernicus) | 40%+ (Jefferies) | 40%+ (Jefferies); 30% FY25–FY27E (Antique) |
| Market cap / backlog | 5.1x (~3.2x incl. Barmer) | 4.2x | 5.7x |
Hitachi's March 2025 backlog is backed out from its reported 53.5% growth. Siemens Energy India's fiscal year ends in September and it listed after its June 2025 demerger, so a clean FY24–FY26 CAGR is not available. Margin definitions differ by company.
Order book: who has the most visibility?
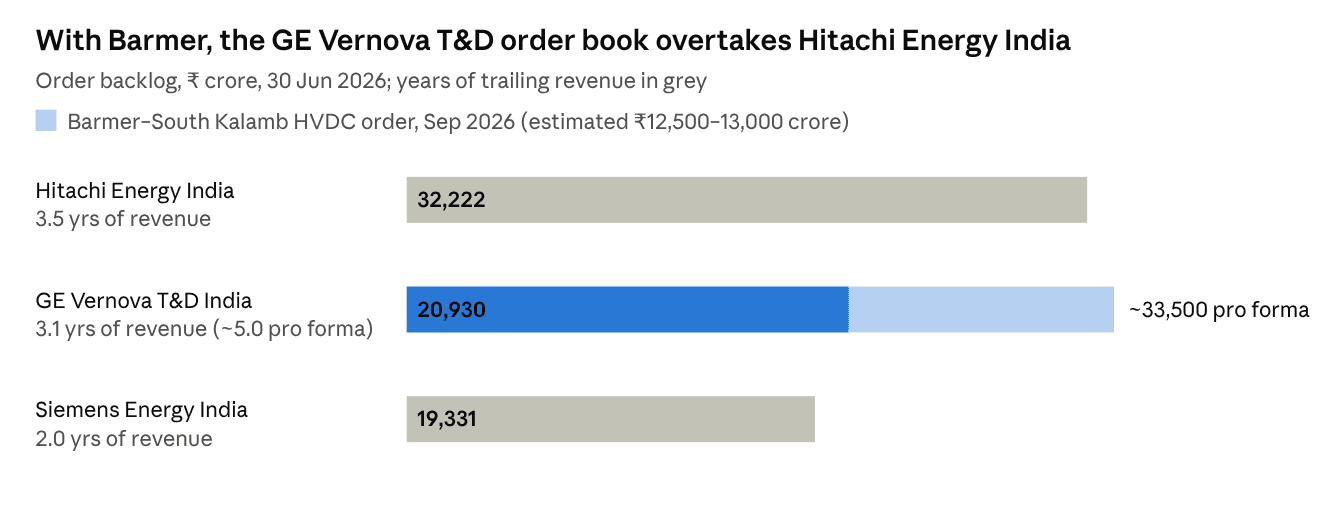
Hitachi Energy India has the largest reported backlog and grew it fastest last year (+54%), helped by HVDC wins. Siemens Energy India's backlog grew only 16% in the year to June 2026, so its growth leans more on execution and margin gains. GE Vernova T&D moves to the top once the Barmer order is booked, but most of that value turns into revenue only from FY29.
Copernicus read: GE Vernova T&D is the most "finished" turnaround of the three. Its margins are already at the top of the range and management is guiding them slightly lower, so EPS growth now depends on revenue alone. Hitachi Energy is the operating-leverage play but at a demanding 115x trailing P/E. Siemens Energy India offers the best balance of growth, returns and multiple right now.
Jefferies reached a similar conclusion in June 2026: it initiated GE Vernova T&D at Hold while keeping Buy on Hitachi Energy India and Siemens Energy India, citing 40%+ earnings CAGR for the latter two (Multibagg summary). Nomura is more positive on GE Vernova T&D (Buy, target raised to ₹6,000 on 65x June 2028 EPS after the Barmer win).
What is GE Vernova T&D worth? Valuation and scenarios
Our base case has EPS compounding at ~24% a year from ₹48 (FY26) to ~₹91 (FY29E). At ₹4,194, the stock already trades at ~72x FY27E and ~58x FY28E, so most of that growth is in the price. Our probability-weighted value is ~₹4,625 by March 2028, about 10% above today.
Copernicus estimates (base case)
| ₹ crore | FY26A | FY27E | FY28E | FY29E |
|---|---|---|---|---|
| Revenue | 6,206 | 7,900 | 10,000 | 13,500 |
| Revenue growth | +45% | +27% | +27% | +35% |
| EBITDA margin | 27.1% | 25.0% | 24.5% | 23.0% |
| EBITDA | 1,684 | 1,975 | 2,450 | 3,105 |
| Net profit | 1,233 | 1,496 | 1,848 | 2,334 |
| EPS (₹) | 48.2 | 58.4 | 72.2 | 91.2 |
| P/E at ₹4,194 | 87x | 72x | 58x | 46x |
Key assumptions: base orders of ₹7,000–8,000 crore a year; HVDC revenue starts late FY28 and scales in FY29 (lower margin, mostly bought-out content); other income ~₹100–120 crore; tax rate 25.2%. Our FY28–FY29 EBITDA is ~13–16% below Nomura's (₹2,832 crore and ₹3,676 crore), mainly because we phase HVDC execution more slowly.
Bear, base and bull scenarios (value by March 2028, on FY29E EPS)
| Scenario | Probability | What has to happen | FY29E EPS (₹) | P/E | Implied value (₹) | vs ₹4,194 |
|---|---|---|---|---|---|---|
| Bear | 25% | HVDC execution slips to FY30, domestic ordering flat, Chinese competition pushes EBITDA margin to ~20% | 70 | 40x | 2,800 | -33% |
| Base | 50% | Backlog converts on schedule, mid-20s margin holds through FY28, one more HVDC win | 91 | 50x | 4,550 | +8% |
| Bull | 25% | US data-centre and ₹3,000 crore export orders land, two more HVDC wins, margin stays ~25% | 110 | 60x | 6,600 | +57% |
| Probability-weighted | ~4,625 | ~+10% |
Scenario values are illustrative outputs of our model for educational purposes, not price targets or recommendations.
An expected return of ~10% over 18 months (~6–7% a year) is below the 12–15% annual hurdle we use for Indian equities. The skew is roughly symmetric, but the bear case is more likely to arrive first because HVDC revenue is back-ended and Q1 FY27 orders were weak.
Can it still be a multi-bagger?
Not from ₹4,194. To double by late 2029, the stock would need about ₹140 of FY30 EPS at 60x, against our FY30 estimate of ~₹111. That requires both an earnings beat of ~25% and no de-rating, a combination rarely seen in a stock already priced at 70x+. History is clear: multi-baggers in this sector (including GE Vernova T&D itself from under ₹150 in early 2023) came from buying turnarounds at low multiples, not from paying peak multiples for peak margins.
Price zones where the risk-reward improves
On our estimates, risk-reward improves at ₹3,600 (~50x FY28E, where expected returns turn double-digit), ₹3,200 (~44x FY28E) and ₹2,800 (~39x FY28E, equal to our bear-case value). For investors tracking the stock, a staggered approach across these zones reduces timing risk. These are analytical reference points, not buy or sell calls.
What could go wrong? Key risks
The biggest risk is not business failure; it is a premium multiple meeting slower earnings growth. Below are the risks we would monitor, ranked by likely impact on the share price.
| Risk | What to watch | Impact |
|---|---|---|
| Margin normalisation | EBITDA margin below 23% for two quarters | High: each 1 point is ~₹80 crore of FY27E EBITDA |
| Valuation de-rating | Sector P/Es compressing from 70–115x; FPI selling | High |
| Chinese competition | TBEA, Taikai, Nanjing Electric bids in GIS and transformer tenders | Medium |
| HVDC timing and execution | Khavda–Olpad or Barmer revenue slipping past FY29 | Medium |
| Lumpy domestic orders and commodities | Quarterly orders below ₹1,500 crore; copper and CRGO steel costs | Medium |
| Parent-related exposure | ₹971 crore in group cash pool; ~3% royalty; group-dependent exports | Medium |
Also worth noting: the company cannot bid for distribution transformers or synchronous condensers in India; those sit with other GE Vernova entities. That caps its addressable market within India.
Copernicus Insights: should investors track or ignore GE Vernova T&D?
Verdict: Track closely, do not chase. GE Vernova T&D India is one of the highest-quality businesses in Indian capital goods: debt-free, ~57% ROE, cash-generative, and holding a backlog worth about five years of revenue. Ignoring it would be a mistake. But at ~72x FY27E earnings, with margins past their peak and profit growth slowing to ~25%, the stock offers limited upside (~10%) and no margin of safety at ₹4,194.
Three insights from this deep dive:
- The story is shifting from margins to execution. FY24–FY26 returns came from margin expansion (4% to 27%). FY27–FY29 returns must come from revenue, and the biggest revenue chunk (HVDC) arrives only from FY29.
- The FY26 cash flow is flattered by advances. ₹965 crore of new customer advances will be consumed as HVDC work progresses. Expect CFO to trail PAT in some quarters of FY28–FY29; that is normal, not a red flag.
- Among the three HVDC players, GE Vernova T&D is the most priced-for-perfection relative to its growth. Siemens Energy India currently offers a better mix of growth, returns and multiple; Hitachi Energy offers more operating leverage.
Investor watchlist: the triggers that would change our view
- Q2 FY27 results (due late Oct/Nov 2026): EBITDA margin at or above 24%, and formal booking of the Barmer HVDC order
- Quarterly order inflow back above ₹1,800–2,000 crore excluding HVDC, confirming the ₹7,000–8,000 crore base-order guidance
- US data-centre order (~₹1,300 crore) booked in Q2–Q3 FY27
- Chinese bidders' outcomes in Power Grid GIS and 765 kV transformer tenders, and the price gap they open
- Use of ~₹1,680 crore surplus cash: higher dividend or buyback (positive) vs larger group cash-pool lending (negative)
- Next HVDC tenders (Lakadia–Alephata, new NCT-approved corridors, Pusauli refurbishment)
- Capex milestones: Vadodara transformer expansion and Chennai HVDC valve line on schedule through 2028
- Price zone of ₹3,200–3,600: where the risk-reward turns favourable on our estimates
What would make us more positive: two consecutive quarters of 25%+ EBITDA margin with 30%+ revenue growth, plus a correction toward ~45x FY28E. What would make us negative: margin below 22% or a second weak domestic order quarter without export offset.
Frequently asked questions
Is GE Vernova T&D India a good stock to buy?
GE Vernova T&D India is a high-quality business with zero debt, ~57% ROE and a backlog of about five years' revenue. At ~72x FY27E earnings, however, our probability-weighted value implies only ~10% upside over 18 months. It suits investors who can wait for a better entry rather than those seeking quick returns.
Why did GE Vernova T&D shares fall from their high?
The stock fell about 26% from its ₹5,650 peak (23 Jun 2026) because of three factors: India allowing four China-linked equipment makers into select tenders, weak Q1 FY27 order intake (-30% YoY) with a 7-point gross-margin drop, and an extreme starting valuation above 110x trailing earnings.
What is the order book of GE Vernova T&D India?
The reported order backlog was ₹20,930 crore on 30 Jun 2026. Including the ~₹12,500–13,000 crore Barmer–South Kalamb HVDC order from Power Grid (L1 on 7 Sep 2026), the pro-forma backlog is about ₹33,500 crore, roughly five times FY26 revenue.
Is GE Vernova T&D India debt free?
Yes. The company had zero borrowings on 31 Mar 2026 and ₹2,930 crore of cash by June 2026, including ₹971 crore lent to a GE group cash pool. It funds its ₹1,000 crore+ capex plan entirely from internal accruals.
Who are GE Vernova T&D's main competitors?
In high-voltage equipment and HVDC, its main listed rivals are Hitachi Energy India and Siemens Energy India. In transformers and switchgear it also competes with CG Power, BHEL, Transformers & Rectifiers and, from 2026, select China-linked suppliers such as TBEA and Taikai.
When will the HVDC orders add to revenue?
Management says HVDC projects spend the first two years on engineering and supply-chain set-up. Meaningful HVDC revenue is expected from FY29 (April 2028 onward), with a small contribution possible in late FY28.
Conclusion
This GE Vernova T&D India share analysis finds a business that has completed one of Indian capital goods' best turnarounds, now valued as if the next phase will be just as smooth. We would keep it firmly on the watchlist and revisit it nearer the ₹3,200–3,600 zone or on evidence of margins holding above 25%.
Related research: Indo SMC share analysis · Inox Green Energy share analysis
Sources
- GE Vernova T&D India Ltd, Annual Report FY2025-26 (Balance Sheet, P&L, Cash Flow, Notes 15, 22, 37; Directors' Report; MD&A), May 2026
- GE Vernova T&D India Q4 FY26 earnings call transcript, 19 May 2026
- GE Vernova T&D India Q1 FY27 earnings call transcript, 7 Aug 2026
- NSE disclosure: Award of order, 7 Sep 2026
- Business Standard: HVDC win boosts revenue visibility, 8 Sep 2026
- Business Today: shares jump 9%, Nomura target, 8 Sep 2026
- PL Capital Q1 FY27 result update, 8 Aug 2026
- Business Standard share price page, 9 Oct 2026
- Screener.in: GE Vernova T&D India, Hitachi Energy India, Siemens Energy India
- Hitachi Energy India Q1 FY27 results release, Aug 2026
- Energetica India: Siemens Energy India Q3 FY26 results
- Energetica India: ICRA transmission capex outlook, 13 Jul 2026
- PV Tech: renewable curtailment and transmission lag, Jul 2026
- 5paisa: power equipment stocks and China tender policy, Jul 2026
- Multibagg: Jefferies power T&D initiation summary, Jun 2026
- ETEnergyWorld: India's power sector enters value-chain reset led by transmission, storage and demand growth
This report is for information only and is not an offer or solicitation to buy or sell any security; views and estimates are as of the date of publication and may change without notice. Investments in securities market are subject to market risks; read all the related documents carefully before investing.