HFCL share price surge: how a ₹60 stock quadrupled in nine months — financials, peers and valuation explained
The HFCL share price surge has turned a forgotten telecom-equipment stock into one of 2026's standout re-ratings. HFCL Ltd (NSE: HFCL, BSE: 500183) hit a low of ₹59.82 in January 2026 and touched a record ₹276 in recent weeks, a 4.6x move in about nine months. Even after a 5% fall to ₹258 on 08 Oct 2026, the stock is up roughly 3.7x in calendar 2026 and its market value has swelled to about ₹39,600 crore.
Behind the rally is a genuine earnings break-out: optical fibre cable (OFC) exports to AI and hyperscale data centres, a record ₹26,665 crore order book and a sharp jump in margins. In this report we trace the price trend, unpack a decade of financials, compare HFCL with Sterlite Technologies, Tejas Networks and ITI, and test what growth today's valuation already assumes.
- Price: ₹258 on 08 Oct 2026, about 4.3x the January 2026 low and roughly 50% above the stock's previous cycle peak near ₹170 (2024).
- Q1 FY27 (Apr–Jun 2026): revenue ₹1,915 crore (+120% YoY), EBITDA margin ~22%, PAT ₹246 crore versus a ₹29 crore loss a year earlier.
- Exports were 55.5% of Q1 FY27 revenue (₹1,063 crore), up from 24% a year earlier, driven by OFC demand from data centres.
- Order book ₹26,665 crore (~5.4x FY26 revenue), including about ₹16,000 crore of OFC orders; management raised FY27 growth guidance to 40%+.
- The catch is cash: FY26 operating cash flow was –₹378 crore and borrowings doubled in two years to ₹1,896 crore, while debtor days stay above 160.
Why is the HFCL share price surging?
The HFCL share price surge is driven by an earnings turnaround that arrived faster than anyone expected. After a loss-making Q4 FY25 and Q1 FY26, profit rebounded for four straight quarters to ₹246 crore in Q1 FY27, powered by data-centre fibre exports, large orders and better pricing.
1. The AI data-centre fibre cycle. Hyperscale and AI data centres need far more optical fibre per rack than conventional server farms, and global OFC demand has run ahead of supply. HFCL's export revenue jumped about 5x year on year to ₹1,063 crore in Q1 FY27. Management expects demand to exceed supply for at least five years.
2. Record orders. A five-year, US$1.1 billion (about ₹10,159 crore) OFC supply contract with an undisclosed global customer, announced in March 2026, is the largest in HFCL's history. It was followed by a ₹2,666 crore BharatNet Phase-3 order from Rail Vikas Nigam (17 June 2026) and a ₹2,329 crore long-term OFC supply agreement (1 September 2026).
3. Margin re-rating. EBITDA margin rose from about 5% in Q1 FY26 to roughly 22% in Q1 FY27, as high-margin telecom products displaced low-margin turnkey (EPC) work. Telecom products earned an EBIT margin of about 30% in the quarter.
4. Guidance upgrades. Management lifted its FY27 revenue-growth aspiration from 20% to 40%+ and targets EBITDA margins above 20%. New engines include data-centre connectivity products (₹700–800 crore targeted in FY27) and defence (about ₹500 crore targeted in FY27).
5. Institutional buying. Foreign institutional holding more than doubled from 7.1% to 15.7% in the June 2026 quarter. The same quarter saw about 71,000 retail shareholders exit, suggesting stock moved from retail to institutional hands.
HFCL stock price trend: three legs of a re-rating
HFCL's 2026 rally came in three legs, each triggered by a hard catalyst rather than sentiment alone. The stock first broke out on the US$1.1 billion order, re-rated on the Q4 FY26 profit turnaround, and then pushed past ₹250 after record Q1 FY27 margins.
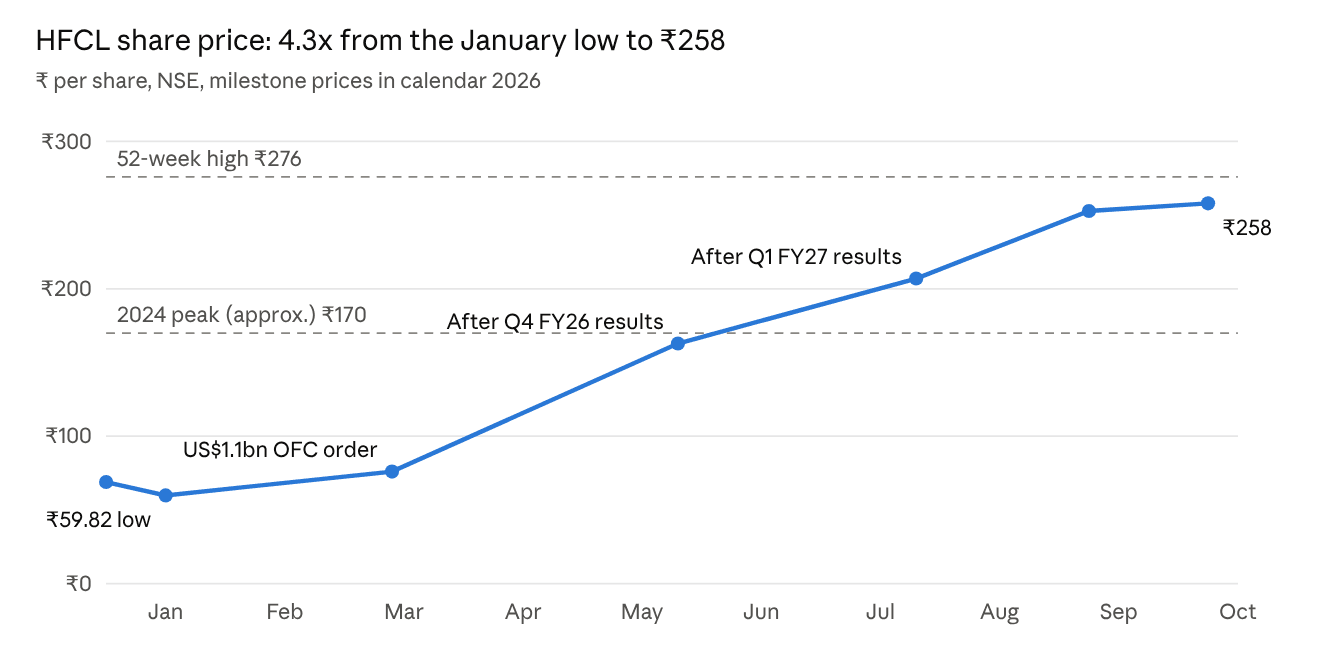
| Period (to 08 Oct 2026) | Starting price | Approx. return |
|---|---|---|
| From January 2026 low | ₹59.82 | +331% (4.3x) |
| Calendar 2026 to date | ~₹68.9 | +274% |
| One year (Screener) | — | +253% |
| Since Q1 FY27 results (24 Jul 2026) | ₹207 | +25% |
| From 52-week high | ₹276 | –6.5% |
Long-term context. For most of the past decade HFCL traded as a low-multiple, government-dependent telecom contractor. Its 10-year share price CAGR is about 33%, but most of that came in two bursts: 2021–24 and 2026. The stock spent 2025 falling from its 2024 peak near ₹170 to the low ₹60s as two loss-making quarters hit.
Volatility. Moves of 5–10% in a session have been common in 2026, including the 5% fall on 08 Oct. With an RSI that stayed in overbought territory through May, sharp pullbacks inside the uptrend should be expected.
What does HFCL do?
HFCL is a telecom-infrastructure company that has pivoted from government network contracting to manufacturing optical fibre, fibre cables and telecom equipment for global buyers. Telecom products now generate about 83% of revenue, against 27% in FY21.
| Segment (Q1 FY27) | Revenue (₹ cr) | Share | YoY growth | EBIT (₹ cr) / margin |
|---|---|---|---|---|
| Telecom products (incl. OFC) | 1,590 | 83% | +193% | 484 / 30.4% |
| Turnkey contracts & services (EPC) | 280 | 15% | –4% | –88 / –31.2% |
| Defence products & services | 24 | 1% | — | –8 |
| Others | 21 | 1% | +100% | — |
The table reveals the core insight: all of HFCL's profit now comes from products. The EPC book lost ₹88 crore in the quarter, so group margins understate what the products franchise earns. Management expects an Army warranty agreement to restart support-services revenue and lift EPC margins.
Order book: ₹26,665 crore
The order book stood at ₹26,665 crore at June 2026, up 154% year on year and about 5.4x FY26 revenue. Products account for ₹17,339 crore (65%), operations & maintenance for ₹5,099 crore and network services for ₹4,227 crore. Private customers are now 61% of the book; government 39%.
About ₹22,000 crore is executable within five years. A separate defence order book of about ₹2,300 crore (including the proposed Defysis aerostructures acquisition) is not counted in that figure.
Capacity and new engines
- Fibre and cable: optical fibre capacity is being expanded from 28 to 34 million fibre-km and OFC from 34 to 43 million fibre-km, targeted by December 2026.
- Preform plant: a ₹580 crore greenfield preform facility (targeted July 2029) should cut raw-material costs and reduce import dependence.
- Data-centre connectivity: high-fibre-count cables (6,912 fibres today, 14,000-fibre versions planned) and passive connectivity, with ₹215 crore approved for high-density termination products.
- Defence: BMP-2 modernisation trials, electronic fuzes, radars and a 1,000-acre ammunition complex in Andhra Pradesh. Management targets about ₹500 crore of defence revenue in FY27 and ₹3,000 crore by FY29.
Capex is guided at about ₹640 crore in FY27 and ₹615 crore in FY28.
How have HFCL's financials trended?
HFCL's financial history is a long plateau followed by a sudden break-out. Revenue hovered between roughly ₹3,800 crore and ₹4,750 crore from FY19 to FY25, with 5-year sales growth of only about 2% a year. Trailing-twelve-month revenue has now jumped to ₹5,993 crore, with operating margin of 19% and PAT of ₹604 crore.
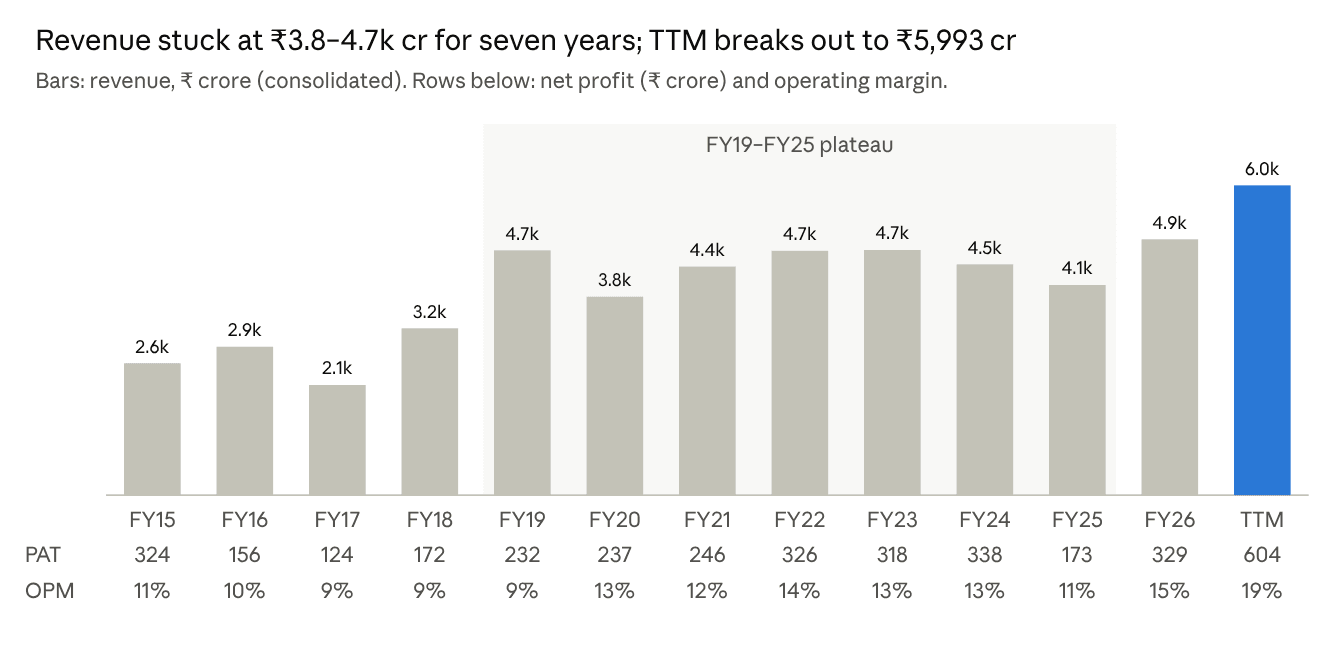
Two things changed in FY26. The revenue mix moved decisively toward products, and operating margin climbed from 11% in FY25 to 15% in FY26 and 19% on a trailing basis. Profit nearly doubled in FY26 to ₹329 crore, but that only restored FY24's level; the real step-change is in the latest quarters.
Quarterly momentum: from losses to record profit
The quarterly picture shows how quickly the turnaround arrived. Q4 FY25 and Q1 FY26 were loss-making as EPC execution stalled and fibre prices were weak. Since then revenue has more than doubled and margins have tripled.
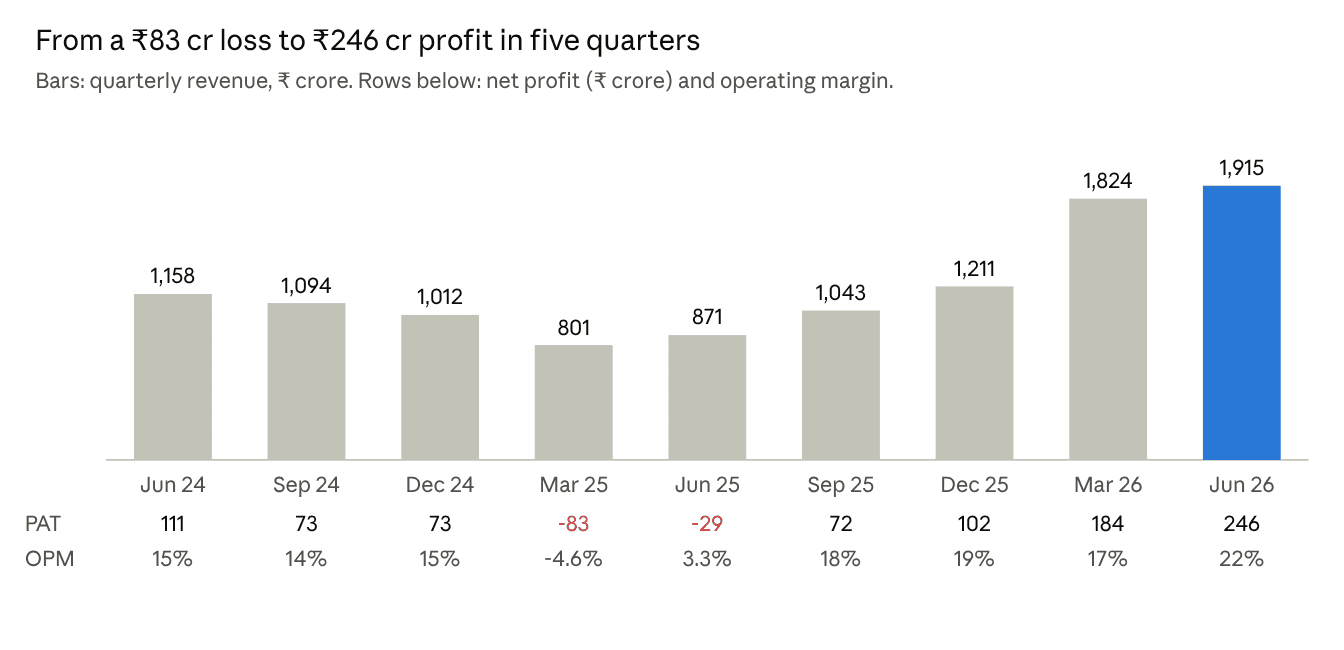
Q1 FY27 revenue of ₹1,915 crore was up 5% on Q4 FY26, yet EBITDA rose about 32% sequentially. Gross margin expanded by nearly 12 percentage points year on year to about 39%, reflecting better OFC pricing, higher-value data-centre products and a lower share of EPC work.
Earnings quality: what is behind the margin jump?
The margin gain looks largely operational, not accounting-driven. Other income was ₹31 crore in Q1 FY27, only about 9% of pre-tax profit. The concern is sustainability: OFC prices are cyclical, and analysts estimate every ₹100 per fibre-km change in OFC pricing moves total revenue by about 3%.
Cash flow and balance sheet: growth is consuming cash
HFCL's reported profits have not converted into cash. Operating cash flow was negative ₹378 crore in FY26 and free cash flow was –₹723 crore, as receivables and inventory ballooned to fund growth.
| ₹ crore (consolidated) | FY22 | FY23 | FY24 | FY25 | FY26 |
|---|---|---|---|---|---|
| Cash from operations | 205 | 235 | –45 | 396 | –378 |
| Free cash flow | 23 | –105 | –454 | –12 | –723 |
| Borrowings | 783 | 936 | 991 | 1,522 | 1,896 |
| Debtor days | 146 | 145 | 181 | 170 | 163 |
| Inventory days | 98 | 113 | 135 | 145 | 191 |
| Cash conversion cycle (days) | 72 | 127 | 175 | 141 | 218 |
| ROCE | 19% | 15% | 13% | 8% | 11% |
Free cash flow has been negative in four of the last five years, and borrowings have doubled since FY23. Equity capital also rose from ₹144 crore to ₹153 crore in FY26, indicating fresh share issuance. Net worth was about ₹4,891 crore at March 2026, so leverage is moderate (debt-to-equity ~0.4x), but working capital is the swing factor for future returns.
Return ratios are the other weak spot. ROE averaged only about 7% over three years, which is why the stock traded near book value for long stretches. On trailing earnings ROE is now about 12%; forecasts assume it reaches 18–20% by FY29.
HFCL vs peers: how does it compare?
Among Indian listed telecom-equipment and fibre makers, HFCL is the only one combining scale, consistent profits and a reasonable multiple. Its closest peer, Sterlite Technologies, has rallied even harder on the same AI-fibre theme but trades at roughly three times HFCL's earnings multiple.
| Company (NSE) | Market cap (₹ cr) | TTM revenue (₹ cr) | TTM PAT (₹ cr) | OPM | P/E (x) | P/B (x) | ROE | 1-yr return |
|---|---|---|---|---|---|---|---|---|
| HFCL (HFCL) | 39,617 | 5,993 | 604 | 19% | 69 | 8.1 | 7.0% | +253% |
| Sterlite Technologies (STLTECH) | 51,862 | 5,642 | 243 | 15% | 220 | 21.8 | 1.2% | +758% |
| ITI (ITI)* | 27,320 | 2,602 | –148 | ~0% | n.m. | 18.2 | –14.7% | +16% |
| Tejas Networks (TEJASNET) | 8,032 | 1,303 | –917 | –50% | n.m. | 2.7 | –26.8% | –21% |
Closing prices of 08 Oct 2026. *ITI: latest available price. n.m. = not meaningful (loss-making). ROE is the latest reported annual figure.
What the peer table tells us
HFCL is the earnings leader. It generates more revenue than Sterlite Technologies and roughly 2.5x its trailing profit, yet is valued about 24% lower. On market cap to sales, HFCL trades near 6.6x against 9.2x for STL and 10.5x for ITI.
The whole fibre complex has re-rated together. STL's 758% one-year gain shows the market is pricing an industry cycle, not just one company. That cuts both ways: shared tailwinds (AI data centres, US tariffs on Chinese fibre, BharatNet) but also shared risk if global fibre prices soften or capacity catches up.
Profitability separates the winners. Tejas Networks, a 4G/5G radio and optical-transport maker, is loss-making on a –₹917 crore TTM basis with very long receivables. ITI remains dependent on government orders and is also loss-making. HFCL's 30% EBIT margin in telecom products is the strongest operating metric in this group.
Where HFCL lags. Its ROE of about 7% (latest full year) and 160+ debtor days are weaker than global fibre leaders. The premium multiple therefore depends on ROE rising quickly as the products mix grows and EPC losses fade.
Global context. Global optical-fibre leaders such as Corning (US), Prysmian (Italy) and Fujikura (Japan) have also re-rated on AI data-centre demand. HFCL's edge is cost and India-based supply; its disadvantage is smaller scale and dependence on fibre preform imports until its own preform plant is commissioned around 2029.
Is HFCL overvalued after the rally?
After the HFCL share price surge, the stock trades at about 66–69x trailing earnings and roughly 36x trailing EV/EBITDA. On forward estimates the multiple compresses quickly, but only if the steep earnings ramp is delivered.
| Valuation basis | Earnings / EBITDA (₹ cr) | Multiple at ₹258 |
|---|---|---|
| Trailing PAT (TTM to Jun 2026) | 604 | ~66x (Screener: 69x) |
| Q1 FY27 PAT annualised | ~984 | ~40x |
| FY27E PAT | 823 | ~48x |
| FY28E PAT | 1,187 | ~33x |
| FY29E PAT | 1,626 | ~24x |
| EV / TTM EBITDA | 1,146 | ~36x |
| EV / FY27E EBITDA | 1,478 | ~28x |
FY27E–FY29E estimates published on 24 Jul 2026, when the stock was ₹207. EV uses FY26 borrowings of ₹1,896 crore.
What growth is priced in? A reverse valuation
We ask what FY31 profit would justify today's ₹39,617 crore market value for an investor seeking a 12% annual return. Compounded for five years, that market value becomes about ₹69,800 crore.
| Exit P/E in FY31 | Required FY31 PAT | Implied PAT CAGR from FY27E (₹823 cr) | Implied FY31 revenue at 12% net margin |
|---|---|---|---|
| 30x | ~₹2,330 cr | ~30% a year | ~₹19,400 cr |
| 25x | ~₹2,790 cr | ~36% a year | ~₹23,300 cr |
| 20x | ~₹3,490 cr | ~44% a year | ~₹29,100 cr |
Illustrative only; not a forecast or price target.
Interpretation. The market is asking HFCL to compound profits at roughly 30–45% a year for four years after FY27, and to reach revenue of around ₹19,000–29,000 crore by FY31. That is three to five times today's revenue and well above management's stated long-term ambition of crossing ₹10,000 crore.
The bar is demanding but not absurd. Current estimates already model a 70% PAT CAGR over FY26–29 from a low FY26 base, and the order book covers more than four years of current revenue. The key swing factors are OFC pricing, capacity ramp-up and working-capital release.
Price-to-book check. At about 8x book value with a historical ROE of 7%, the market is clearly looking through past returns. If ROE reaches the 18–20% forecast for FY29, a P/B of 8x would look far more conventional for a growth manufacturer.
What are the key risks for HFCL investors?
The biggest threat to the HFCL share price surge is a turn in the fibre cycle. The rally rests on OFC pricing and export demand that have historically been volatile, while cash generation lags reported profit.
- Fibre-price cyclicality. OFC prices collapsed in 2019–20 and again weighed on FY25. A ₹100 per fibre-km fall moves revenue by about 3%, with a larger hit to profit.
- Customer concentration. The US$1.1 billion contract is with a single undisclosed global customer; any delay, renegotiation or cancellation would dent the order book.
- Working capital and debt. Negative operating cash flow in FY26, a 218-day cash conversion cycle and borrowings near ₹1,900 crore leave little room for execution slips during a ₹1,250 crore two-year capex plan.
- EPC drag. The turnkey segment lost ₹88 crore in Q1 FY27; delayed government payments or warranty negotiations could prolong this.
- Execution on new businesses. Defence (target ₹3,000 crore by FY29), data-centre products and the preform plant are all early-stage and capital-hungry.
- Trade policy. US tariffs currently favour Indian fibre over Chinese supply; a shift in tariff policy could change export economics quickly.
- Promoter holding and dilution. Promoter stake fell from 36.2% (Sep 2024) to 28.3% (Jun 2026), and share capital expanded in FY26. A restructuring committee with EY as adviser is evaluating group structure; its outcome is unknown.
- Momentum risk. After a 4x move, a single soft quarter can trigger sharp drawdowns, as the 5% fall on 08 Oct 2026 shows.
What should investors watch next?
Whether the HFCL share price surge can hold depends on the next two quarters of delivery. These are the markers we will track:
- Q2 FY27 results (Oct–Nov 2026): revenue growth near the 40% annual guidance and EBITDA margin above 20%.
- Operating cash flow and debtor days in the half-yearly balance sheet; positive CFO would materially de-risk the story.
- Capacity commissioning of the 34 million fibre-km fibre and 43 million fibre-km cable lines by December 2026.
- Order inflow after the ₹26,665 crore book, especially data-centre and export orders.
- EPC turnaround: the Army warranty agreement and segment losses narrowing.
- Defysis acquisition and defence revenue versus the ₹500 crore FY27 aspiration.
- Group restructuring recommendations and any change in promoter holding.
Copernicus take
Our view is that the HFCL share price surge is anchored in a real business change, not just a theme trade, but the stock has moved ahead of the evidence on cash. The products franchise, earning about 30% EBIT margins on export-led fibre demand and backed by a ₹26,665 crore order book, is a structurally better business than the EPC-heavy HFCL of the past decade. What the market has not yet seen is that profit turning into cash: operating cash flow was negative in FY26, receivables still exceed 160 days, and borrowings have doubled since FY23.
At roughly 48x FY27 and 33x FY28 estimated earnings, the price already assumes margins hold above 20% through a fibre cycle that has turned sharply twice in seven years. For investors studying the name, the two signals that matter most over the next two quarters are a return to positive operating cash flow and EBITDA margins holding near Q1 FY27 levels; if both arrive, the re-rating has a firmer foundation, and if either slips, the multiple has little cushion. This is an educational assessment, not a recommendation to buy, sell or hold.
Frequently asked questions
Why is the HFCL share price going up?
The HFCL share price surge is driven by a sharp earnings turnaround. Q1 FY27 PAT reached ₹246 crore against a loss a year earlier, exports rose about 5x on data-centre fibre demand, the order book hit ₹26,665 crore and management raised FY27 growth guidance to 40%+.
What does HFCL make?
HFCL makes optical fibre, optical fibre cables, telecom equipment such as routers, radios and Wi-Fi systems, and data-centre connectivity products. It also executes telecom network (EPC) projects and is building a defence business spanning ammunition, fuzes, radars and vehicle upgrades.
Is HFCL share overvalued compared with peers?
HFCL trades at about 69x trailing earnings and 8x book value, which is expensive on history. Against peers it looks cheaper: Sterlite Technologies trades near 220x earnings, while Tejas Networks and ITI are loss-making. On FY28 estimates, HFCL's P/E falls to about 33x.
What is HFCL's order book?
HFCL's order book was ₹26,665 crore at June 2026, about 5.4x FY26 revenue. Products, mostly optical fibre cable, make up ₹17,339 crore. Private customers account for 61% and government for 39%, with a further ₹2,300 crore defence pipeline reported separately.
What is HFCL's FY27 guidance?
Management raised its FY27 revenue-growth aspiration to 40% or more, from 20% earlier, and targets EBITDA margins above 20%. It also expects about ₹700–800 crore from data-centre connectivity products and around ₹500 crore from defence in FY27.
Is HFCL debt-free?
No. Consolidated borrowings were about ₹1,896 crore at March 2026, roughly double FY23 levels, giving a debt-to-equity ratio of around 0.4x. Operating cash flow was negative in FY26 as working capital expanded with growth.
Related research: Cupid share price surge · Indo SMC share analysis
This report is for information only and is not an offer or solicitation to buy or sell any security; views and estimates are as of the date of publication and may change without notice. Investments in securities market are subject to market risks; read all the related documents carefully before investing.