Tonbo Imaging IPO analysis: financials, DRHP highlights and valuation at ₹700
Tonbo Imaging India Ltd (NSE/BSE listing proposed) is asking ₹4,010 crore of market value, or 78.8x FY26 earnings, in a ₹852.18 crore offer-for-sale that closes on 19 October 2026. This Tonbo Imaging IPO analysis breaks down the Red Herring Prospectus: a high-margin, IP-owning defence-optics business.
You will learn what Tonbo makes, how its numbers trend from FY24 to Q1 FY27, how it compares with Paras Defence and Data Patterns, and the DRHP points that matter most before you bid.
Data as of 16 Oct 2026 (RHP dated 10 Oct 2026).
- Pure OFS of ₹852.18 crore (1.22 crore shares at ₹665–700); Tonbo receives no money. Two CEAQ entities sell about 75% of the offer.
- FY26 revenue ₹362.65 crore (−22.7% YoY) and PAT ₹50.88 crore (−30.1% from FY25), but EBITDA margin held at 28.85%.
- Q1 FY27 (Apr–Jun 2026) loss of ₹17.74 crore on ₹36.01 crore revenue; the business is second-half heavy.
- Operating cash flow negative: −₹136.12 crore in FY25 and −₹63.22 crore in FY26; working capital days rose to 517.
- Order book ₹314.24 crore (30 Jun 2026) plus ₹118.15 crore of orders won in Jul–Sep 2026; the IPO was 7.78x subscribed by the end of Day 2.
What are the Tonbo Imaging IPO price band, lot size and dates?
The price band is ₹665–700 per share with a lot of 21 shares, so the minimum retail bid is ₹14,700. Bidding runs 15–19 October 2026; allotment is expected on 21 October and listing on BSE and NSE on 23 October.
What does Tonbo Imaging do?
Tonbo designs electro-optical and infrared (EO/IR) systems for armies: thermal weapon sights, handheld thermal binoculars, targeting and fire-control systems, and missile seekers. It owns the designs and outsources manufacturing to EMS partners such as Kaynes Technology and Avalon Technology, an asset-light model run by 339 permanent staff in Bengaluru. The fun fact about the technology of this company is that it was widely used in “Operation Sindoor”.
Incorporated in 2003 as a Sarnoff Corporation R&D unit, it became a defence product company after a 2012 promoter buyout and won its first production order in 2015. More than 28,000 systems are deployed across 24 countries (30 Jun 2026).
What is Tonbo's competitive moat?
The moat is owned, export-free IP. Tonbo says it owns 100% of its IP since March 2024, when it bought it from shareholder CEAQ Singapore for ₹183.19 crore. Its infrared portfolio is free of US ITAR restrictions, so it can sell to countries that US-sourced rivals cannot.
The Frost & Sullivan report in the RHP (commissioned by Tonbo) ranks it first by sales value in thermal imaging systems supplied to Indian government and defence agencies in FY25–FY26, with about 51% of units and 94% of India's thermal-imaging exports by units.
How is revenue split by segment and customer (FY26)?
| Mix, FY26 | ₹ crore | Share of revenue |
|---|---|---|
| Tactical systems (sights, binoculars, targeting) | 211.68 | 58.4% |
| Platform systems (vehicle, drone, seekers) | 144.81 | 39.9% |
| Indian government customers | — | 71.2% |
| Private system integrators | — | 24.1% |
| Foreign governments | — | 3.3% |
FY26 = Apr 2025–Mar 2026.
Platform systems are the story to watch: revenue rose from ₹12.70 crore in FY24 to ₹144.81 crore in FY26. These are larger integrated contracts, which is how a sight-maker becomes a systems supplier.
Tonbo Imaging financials: is the company profitable?
Yes, in every full year: PAT was ₹68.54 crore in FY24, ₹72.76 crore in FY25 and ₹50.88 crore in FY26. The quality of growth is the issue. Revenue fell 22.7% in FY26 and Q1 FY27 swung to a loss, though margins stayed among the best in Indian defence hardware.
| ₹ crore (restated consolidated) | FY24 | FY25 | FY26 | Q1 FY27 (Apr–Jun 2026) |
|---|---|---|---|---|
| Revenue from operations | 428.19 | 469.08 | 362.65 | 36.01 |
| YoY growth | 342.2% | 9.6% | −22.7% | — |
| Gross margin | 48.6% | 56.4% | 51.1% | 37.7% |
| EBITDA | 112.32 | 139.06 | 104.62 | −13.04 |
| EBITDA margin | 26.2% | 29.7% | 28.9% | −36.2% |
| Profit after tax | 68.54 | 72.76 | 50.88 | −17.74 |
| PAT margin | 16.0% | 15.5% | 14.0% | — |
| Diluted EPS (₹) | 13.63 | 12.70 | 8.88 | −3.20 |
| Net worth | 230.13 | 490.14 | 553.16 | 538.54 |
| ROE | 52.7% | 20.2% | 9.8% | −3.3% (not annualised) |
| ROCE | 67.8% | 27.4% | 14.5% | −4.3% (not annualised) |
| Total borrowings | 96.36 | 78.14 | 116.06 | ~130 |
PAT margin on revenue from operations is our calculation.
Why did FY26 revenue and profit fall?
The RHP blames West Asia conflict delays on international orders and some contracts slipping into FY27. Exports collapsed from ₹307.34 crore (65.5% of revenue) in FY25 to ₹20.21 crore (5.6%) in FY26, while domestic sales more than doubled to ₹337.47 crore.
Is the Q1 FY27 loss a red flag?
Partly. Defence revenue in India is back-ended, as ministries book deliveries in H2, so one weak quarter is normal. But Q1 FY27 revenue of ₹36 crore against fixed employee and R&D costs (₹26 crore R&D in FY26) shows how sharp the operating leverage is in both directions.
Why is Tonbo's cash flow negative despite profits?
Cash is stuck in inventory and receivables. Tonbo booked ₹123.64 crore of PAT across FY25–FY26 yet burned ₹199.34 crore in operating cash flow over the same two years. This is the single biggest gap between the headline numbers and the underlying economics.
| ₹ crore | FY24 | FY25 | FY26 | Q1 FY27 |
|---|---|---|---|---|
| Cash flow from operations | 78.33 | −136.12 | −63.22 | −14.68 |
| Inventory (period end) | — | 111.14 | 219.49 | 319.63 |
| Working capital days | 152 | 280 | 517 | n.m. |
| Receivable days | — | 118 | 212 | — |
| Net cash / (net debt) | — | ~102 net cash | — | ~35 net debt (Jun 2026) |
Net cash/debt as computed by MoneyWorks4Me from RHP balances.
Our cash-conversion test
We apply a simple red-flag test: profit that does not turn into cash within 12–18 months is a warning on earnings quality. Inventory of ₹319.63 crore at June 2026 now exceeds the ₹314.24 crore order book.
That can be benign: Tonbo may be stocking components for H2 FY27 deliveries. If H2 deliveries happen, inventory should fall sharply by March 2027 and operating cash flow should turn positive. If inventory stays above ₹250 crore at March 2027, the working-capital story becomes structural.
The OFS adds no cash. Funding this cycle depends on borrowings (₹116 crore at FY26) and supplier credit; the CEO told CNBC-TV18 on 15 October that creditor relationships make working capital manageable.
How strong is Tonbo Imaging's order book?
The confirmed order book was ₹314.24 crore on 30 June 2026, about 0.87x FY26 revenue: ₹231.87 crore domestic (30 orders) and ₹82.37 crore overseas (6 orders). Tonbo added ₹118.15 crore of new orders in Jul–Sep 2026, after the RHP cut-off.
| Period end | Order book (₹ crore) | Bid win rate |
|---|---|---|
| 30 Jun 2026 | 314.24 | 14.3% (2 of 14, Q1 FY27) |
| 31 Mar 2026 | 279.02 | 34.4% (45 of 131, FY26) |
| 31 Mar 2025 | 218.61 | 35.9% (FY25) |
| 31 Mar 2024 | 563.14 | 40.9% (FY24) |
The order book is recovering but still 44% below March 2024. Adding the Jul–Sep inflow gives roughly ₹430 crore of visibility, enough to support FY27 revenue near FY25 levels if execution holds.
How concentrated are Tonbo's customers?
Very. The top five customers gave 53.0% of FY26 revenue and 92.1% in Q1 FY27; the top ten gave 77.8% in FY26 and 95.5% in FY25. One overseas customer alone contributed 57.07% of FY25 revenue, which is why exports swung from 65.5% to 5.6% in a year.
Is the Tonbo Imaging IPO valuation expensive?
On earnings, it is priced in line with the sector, not cheap. At ₹700 the P/E is 78.8x FY26 EPS, just under the 81.6x average of five listed defence peers, but on a profit base that fell 30% and turned to a loss in Q1 FY27.
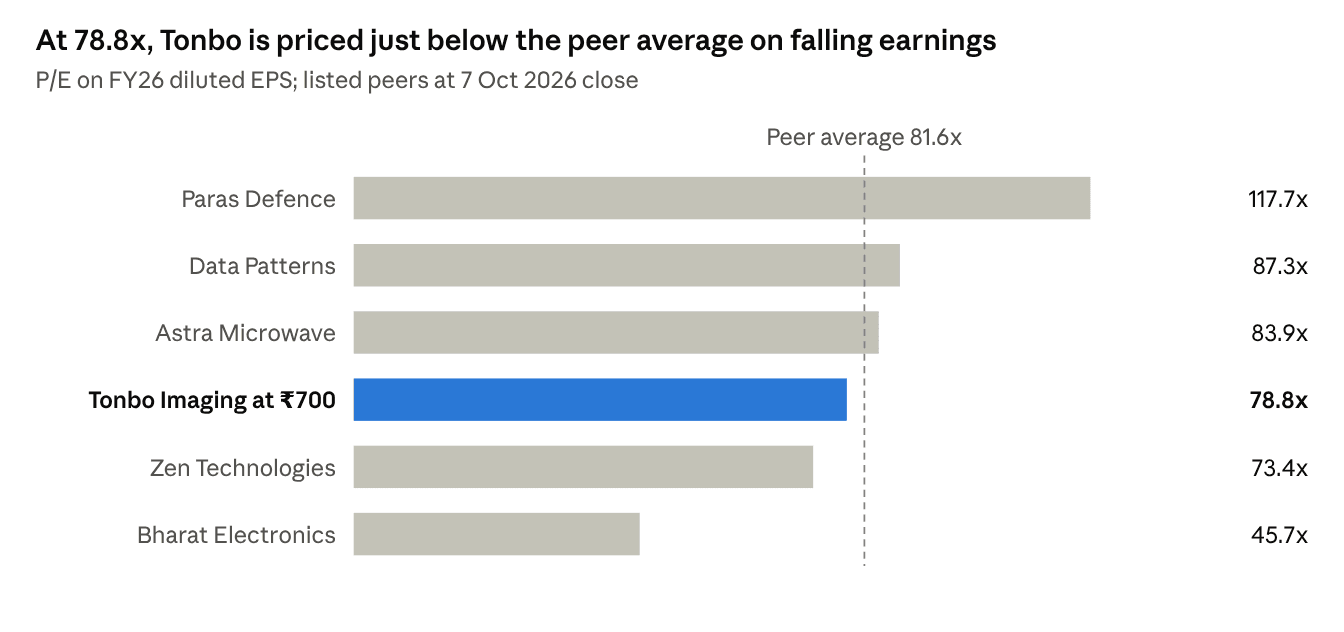
Peer P/E at 7 Oct 2026 close; Tonbo P/E at ₹700 is our calculation.
The closest peer, Paras Defence, trades at 117.7x but grew FY26 sales about 31% while Tonbo's fell 23%. The discount is earned, not a bargain.
Our valuation multiples (post-IPO, at ₹700)
These go beyond the P/E most IPO reviews stop at, and account for the debt Tonbo has taken on.
| Metric | Value | Basis |
|---|---|---|
| Market cap | ₹4,010 crore | 5.73 crore shares × ₹700 |
| Enterprise value | ~₹4,045 crore | + ~₹35 crore net debt (Jun 2026) |
| EV / EBITDA | 38.7x | FY26 EBITDA ₹104.62 crore |
| EV / Sales | 11.2x | FY26 revenue ₹362.65 crore |
| Price / Book | 7.4x | Net worth ₹538.54 crore (Jun 2026) |
| Earnings yield | 1.3% | FY26 PAT / market cap |
Our calculations from RHP data.
What value range do our scenarios imply? (illustrative, FY28E)
We model FY28 (Apr 2027–Mar 2028) because FY27 is distorted by order slippage. These are educational assumptions, not a price target.
| Scenario | Probability | FY28E revenue | PAT margin | FY28E PAT | P/E | Implied value / share |
|---|---|---|---|---|---|---|
| Bear: exports stay weak, WC drag | 30% | ₹400 crore | 11% | ₹44 crore | 45x | ~₹346 |
| Base: order book converts, exports partly return | 50% | ₹560 crore | 15% | ₹84 crore | 55x | ~₹806 |
| Bull: platform systems scale, exports recover | 20% | ₹720 crore | 17% | ₹122 crore | 65x | ~₹1,384 |
| Probability-weighted | ~₹784 |
The weighted value of about ₹784 is roughly 12% above the ₹700 issue price over 18 months. Against our checklist, a 2–3x outcome needs the bull case, which is a 20% probability. That makes this a selective, high-risk bet rather than a clear multi-bagger setup at this price.
Tonbo Imaging DRHP highlights: what can appeal to IPO investors?
The investment case rests on owned technology in a protected, growing market. These are the ten DRHP and RHP points that bullish investors and the 43 anchor funds are underwriting.
- India's #1 thermal-imaging supplier to government by sales value in FY25–FY26, with about 51% of units supplied (Frost & Sullivan, company-commissioned).
- 94% of India's thermal-imaging exports by units, giving rare export credibility for an Indian defence-tech firm.
- 100% owned, ITAR-free IP after the ₹183.19 crore buyback from CEAQ Singapore, ending royalties to a related party.
- Hardware with software-like margins: EBITDA margin of 26–30% across FY24–FY26 and gross margin above 48%.
- Asset-light model: manufacturing outsourced to EMS partners, so growth needs little capex.
- Move up the value chain: platform systems grew 11x in two years to ₹144.81 crore (39.9% of FY26 revenue), including a multimode seeker integrated into an Indian anti-tank guided missile in 2024.
- Order momentum after the RHP cut-off: ₹118.15 crore won in Jul–Sep 2026 on top of the ₹314.24 crore June order book.
- Pipeline in counter-drone and directed-energy systems, both priority buys under the Defence Ministry's IDDM (Indigenously Designed, Developed and Manufactured) push.
- Clean audit and legal record: no auditor qualifications for three years and no outstanding criminal proceedings against the company or directors, per the RHP.
- Quality anchor book: ₹255.4 crore from 43 anchors; Indian mutual funds took 57.7% and insurers 7.8%, with half locked in for 30 days and half for 90.
Why does the sector backdrop matter?
India's defence electronics market was about US$10.6 billion in 2025 and is forecast at US$17.6 billion by 2030 (~11% CAGR, per the RHP's industry report). India's defence exports rose to ₹23,622 crore in FY25 from ₹686 crore in FY14, per government data. Tonbo is a direct, first-order beneficiary rather than a component supplier to one.
What are the key risks in the Tonbo Imaging IPO?
The biggest risks are lumpy tender-driven revenue, negative cash conversion and a valuation that already prices recovery. Each is disclosed in the RHP's risk factors.
| Risk | What the RHP shows | What to monitor |
|---|---|---|
| Lumpy, tender-based revenue | Revenue −22.7% in FY26; Q1 FY27 loss of ₹17.74 crore | H2 FY27 revenue vs ₹430 crore visibility |
| Customer concentration | Top 5 = 53.0% of FY26; one customer = 57.1% of FY25 | Any new export order above ₹50 crore |
| Cash conversion | OCF −₹136 crore (FY25), −₹63 crore (FY26); WC days 517 | Inventory falling below ₹200 crore by Mar 2027 |
| Falling win rate | 14.3% in Q1 FY27 vs 34.4% in FY26 | Win rate in H1 FY27 results |
| No IPO proceeds | 100% OFS; debt rose to ~₹130 crore | Borrowings and finance cost each quarter |
| Related-party history | Core IP bought for ₹183.19 crore from CEAQ Singapore, now the largest seller | Any further related-party transactions |
| Allegations | Complaints of sourcing components from Chinese OEMs via CEAQ Pte and of below-cost bids; Tonbo refutes all, no ruling yet | Outcome of the disclosed complaints and lawsuit |
| Supplier dependence | Few global suppliers for critical detectors; outsourced EMS on non-exclusive contracts | Supply disruptions, localisation progress |
| Company-paid market data | Market-share claims come from a Frost & Sullivan report Tonbo commissioned | Independent tender data |
| Post-listing supply | Promoters drop to ~14.0% post-IPO; anchor lock-ins end at 30 and 90 days | Block deals near lock-in expiry |
Allegations as reported by Inc42.
The Chinese-sourcing allegation deserves weight in a defence stock. Even unproven, it can delay Ministry of Defence vendor approvals, which is the core of Tonbo's domestic business.
Our analyst view: what should investors watch next?
Tonbo is a genuine technology franchise priced for a recovery that has not yet shown up in the numbers. The FY26 dip has a credible explanation (export slippage), and margins prove pricing power. But two years of negative operating cash flow and rising inventory are the same pattern we flagged on other richly valued Indian electronics names.
From an educational standpoint, the setup splits by investor type:
- Listing-day focus: strong anchor and NII demand point to a positive debut, but listing gains are sentiment, not fundamentals.
- Long-term focus: the base case implies modest upside from ₹700. A better risk-reward may come after listing if the price corrects towards ₹500–550 (roughly 56–62x FY26 EPS) or once H2 FY27 proves the order-book conversion. Staggered entry suits a volatile, lumpy business.
The five numbers to track after listing
- H1 FY27 results (Apr–Sep 2026): revenue run-rate and whether the Q1 loss narrows
- Operating cash flow turning positive by FY27 (Mar 2027)
- Inventory falling from ₹319.63 crore
- Order book above ₹400 crore, with a large export order
- Resolution of the disclosed allegations and lawsuit
Frequently asked questions
Is the Tonbo Imaging IPO good or bad?
It depends on horizon. Tonbo has owned IP, ~29% EBITDA margins and a ₹314 crore order book. Against that, FY26 revenue fell 22.7%, PAT fell 30%, cash flow was negative for two years and Q1 FY27 was a loss. At 78.8x earnings, the price already assumes a recovery.
What is the Tonbo Imaging IPO price band and lot size?
The price band is ₹665–700 per share and one lot is 21 shares, so the minimum retail bid is ₹14,700. A retail investor can bid up to 13 lots (273 shares, ₹1,91,100). Bidding closes on 19 October 2026.
Does Tonbo Imaging get any money from the IPO?
No. The ₹852.18 crore issue is a 100% offer for sale. Two CEAQ entities sell about 75% of the shares, the three promoters about 16% and other holders the rest. The company's working capital and debt are untouched by the IPO.
Is Tonbo Imaging profitable?
Yes, for each full year: PAT was ₹68.54 crore in FY24, ₹72.76 crore in FY25 and ₹50.88 crore in FY26. Q1 FY27 (Apr–Jun 2026) was a loss of ₹17.74 crore on ₹36.01 crore of revenue, as most deliveries fall in the second half.
Who are Tonbo Imaging's listed peers?
The RHP compares Tonbo with Paras Defence (117.7x P/E), Data Patterns (87.3x), Astra Microwave (83.9x), Zen Technologies (73.4x) and Bharat Electronics (45.7x). The peer average is 81.6x, against Tonbo's 78.8x at the ₹700 upper band.
Conclusion
This Tonbo Imaging IPO analysis finds a high-quality defence-optics franchise at a full price: 78.8x P/E and 38.7x EV/EBITDA on a down year with negative cash flow. Our probability-weighted value of about ₹784 leaves limited margin of safety at ₹700, so the long-term case hinges on H2 FY27 order conversion.
Related research: GE Vernova T&D India share analysis · Jio Platforms IPO 2026
This report is for information only and is not an offer or solicitation to buy or sell any security; views and estimates are as of the date of publication and may change without notice. Investments in securities market are subject to market risks; read all the related documents carefully before investing.