Websol Energy share analysis: is the 55% price drop a buying opportunity or a value trap?
Websol Energy System Ltd (NSE: WEBELSOLAR, BSE: 517498) ended trading at ₹62.36 on 21 October 2026, 55% below its 52-week high of ₹137.90. Trading at roughly 8.6 times trailing earnings, it appears to be the cheapest listed solar manufacturer in India. But is that low valuation an opportunity or a red flag? In this analysis, we examine Websol’s Q1 FY27 results, its shrinking margins, the rapid build-out of solar cell capacity across India, the company’s 4 GW expansion plan, and a bear, base and bull case valuation to find out.
- Cheap on paper: the stock trades at 8.6x TTM earnings (TTM PAT ₹314 crore) and 4.3x book, against 11–27x for listed solar peers on FY27 estimates.
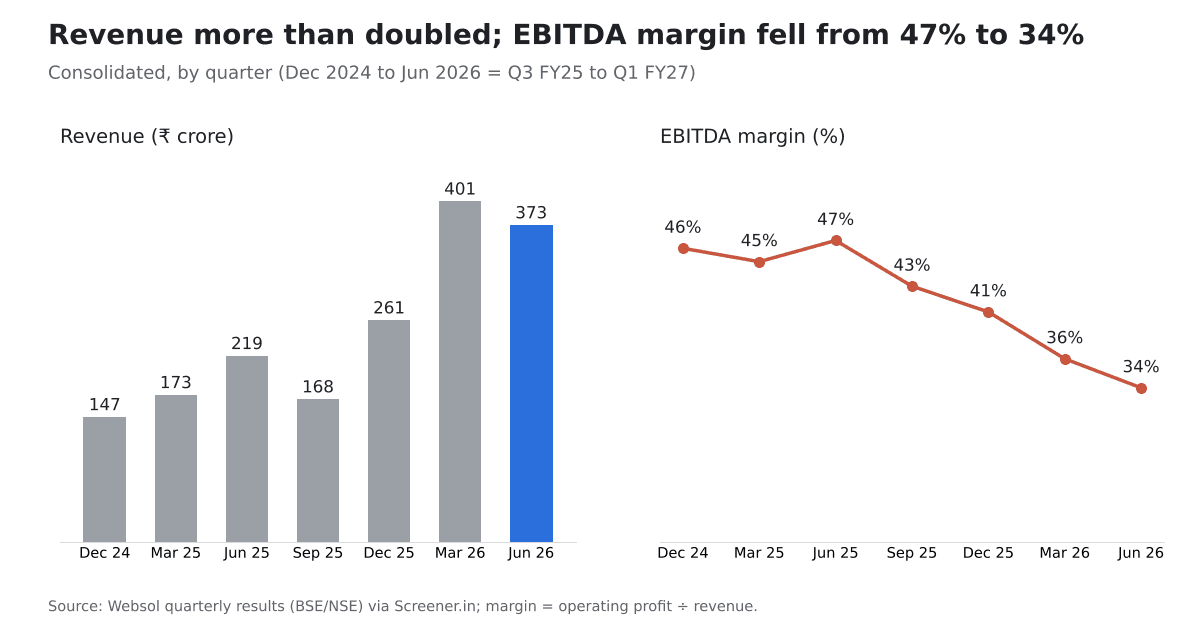
- Margins are falling: EBITDA margin dropped from 47% to 34% in a year as module sales rose and cell prices softened.
- Negative operating leverage: Q1 FY27 revenue grew 70%, but net profit grew only 16%.
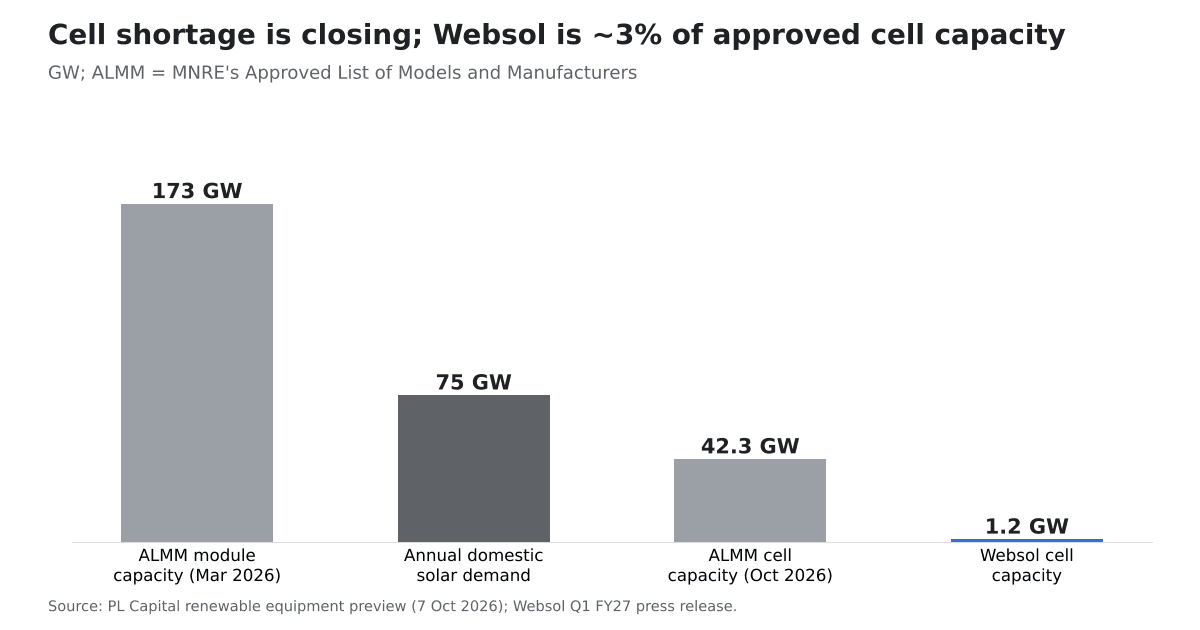
- The moat is narrowing: India's approved solar cell capacity has reached 42.3 GW; Websol's 1.2 GW is about 3% of it.
- Our model: a probability-weighted value of about ₹65 (bear ₹18 / base ₹68 / bull ₹128), only ~4% above the current price.
What does Websol Energy make?
Websol makes solar cells and solar modules at a single plant in the Falta SEZ, West Bengal. Cells are the scarcer, higher-margin product; modules are assembled from cells. It is one of the ALMM-approved cell makers in India and the only one in the eastern region.
| Item | Detail (as of Q1 FY27) |
|---|---|
| Cell capacity | 1,200 MW (Mono PERC, ~23.4% efficiency) |
| Module capacity | 550 MW |
| Q1 FY27 production | 259 MW cells (92% utilisation); 103 MW modules (81% utilisation) |
| Order book | ₹1,278 crore at 30 Jun 2026 |
| Main markets | Domestic Content Requirement (DCR) projects: PM-KUSUM, PM Surya Ghar rooftop |
| Next upgrade | One 600 MW PERC line converting to 750 MW TOPCon; cell capacity to 1,350 MW by Feb–Mar 2027 |
| Big plan | New 4 GW cell + 4 GW module plant at Falta, in two 2 GW phases |
The business model is simple. Government schemes such as PM-KUSUM require panels built with Indian-made cells. Until recently few Indian firms could make cells, so Websol sold every cell it produced at a premium. That scarcity is the source of its very high margins, and it is now what the market doubts.
How did Websol perform in Q1 FY27?
Q1 FY27 (Apr–Jun 2026) showed strong volumes but weaker profitability. Revenue rose 70% to ₹372.6 crore, but EBITDA rose only 21% and net profit only 16%, to ₹77.8 crore.
| Metric (consolidated) | Q1 FY26 | Q1 FY27 | YoY change |
|---|---|---|---|
| Revenue from operations (₹ crore) | 218.8 | 372.6 | +70% |
| EBITDA, ex other income (₹ crore) | 103.5 | 125.6 | +21% |
| EBITDA margin | 47% | 34% | –13 pts |
| Net profit (₹ crore) | 67.2 | 77.8 | +16% |
| EPS (₹, diluted) | 1.57 | 1.79 | +14% |
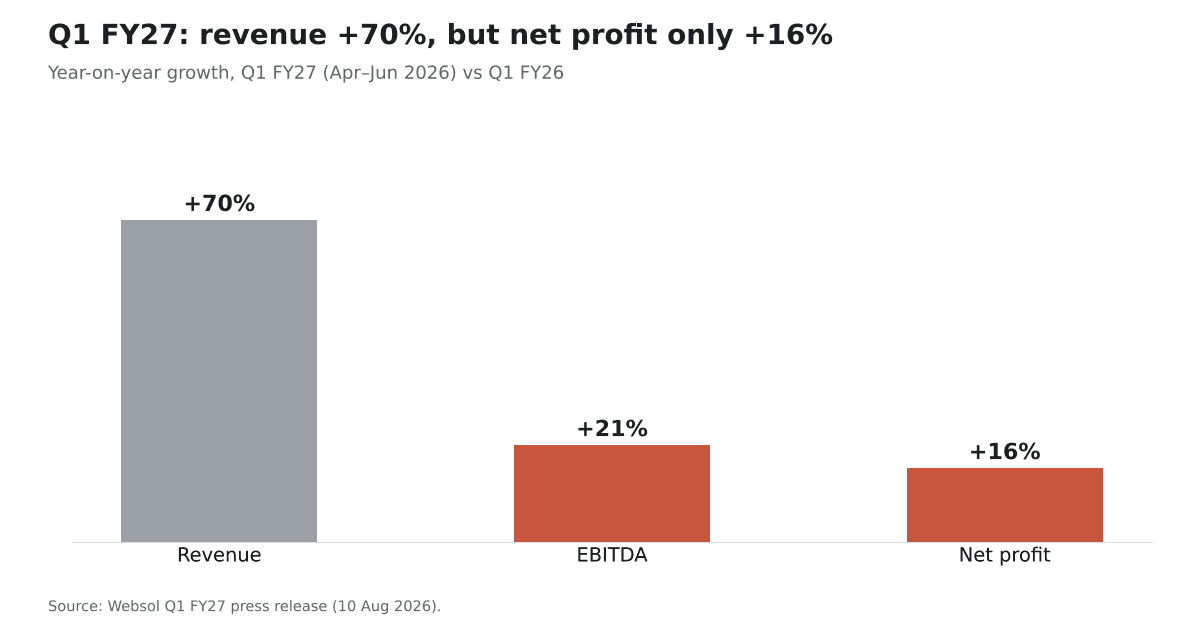
Management blamed the margin drop on mix: module output doubled, and modules earn far less than cells. That is true, but it is not the whole story. Sequentially, revenue fell 7% and profit fell 38% from Q4 FY26, and cell prices softened through the year.
Websol financials: record profits, shrinking margins
FY26 (Apr 2025–Mar 2026) was a record year: revenue rose 82% to ₹1,049 crore and net profit almost doubled to ₹303 crore. But the quarterly trend shows margins falling in every quarter since June 2025.
| Metric (₹ crore) | FY25 | FY26 | Change |
|---|---|---|---|
| Revenue | ~576 | 1,049 | +82% |
| EBITDA | 253 | 429 | +70% |
| EBITDA margin | 43.9% | 40.8% | –3.1 pts |
| Net profit | 155 | 303 | +96% |
FY25 revenue implied from the reported 82.4% growth.
Return on equity of about 67% (Screener.in) is extraordinary for a manufacturer. It signals pricing power that rarely lasts in a commodity industry once new supply arrives.
Is Websol's profit backed by cash flow?
Yes, so far. Operating cash flow was ₹255 crore in FY26 (59% of EBITDA) and free cash flow was ₹75 crore after capex. On 4 Aug 2026, Websol prepaid its entire ₹110 crore IREDA loan from internal cash, and net debt was about –₹34 crore (net cash) at June 2026.
The warning sign is working capital. Inventory days rose from 70 to 142 in FY26 and the cash conversion cycle widened from 8 to 113 days. Management said inventory built up because buyers deferred offtake. If that persists, it would suggest demand for Websol's PERC products is softening.
| Working capital (consolidated) | FY25 | FY26 |
|---|---|---|
| Debtor days | 3 | 35 |
| Inventory days | 70 | 142 |
| Payable days | 66 | 63 |
| Cash conversion cycle | 8 | 113 |
Promoter pledge: resolved
After the IREDA prepayment, promoter shares pledged to IREDA were released, including 2.02 crore shares disclosed on 14 Oct 2026. Promoters own 29.72% of the company (Sep 2026), which is low for an Indian small cap; retail investors hold about 66%.
Why is Websol Energy share falling?
The market is pricing the end of India's solar cell shortage. The stock has fallen 46% in a year even as profits doubled, because investors expect Websol's cell premium to shrink as rivals add capacity.
Three forces are at work:
- Cell supply is surging. ALMM List-II for cells, in force since 1 June 2026, now covers about 42.3 GW of capacity. Premier Energies alone reached 10.6 GW after commissioning a 7 GW plant.
- Module glut. Approved module capacity is ~173 GW against ~75 GW of annual domestic demand, so module prices are under pressure. Websol is selling more modules, which dilutes margins.
- Technology shift. New capacity is mostly TOPCon (~24.5% efficiency); Websol's lines are Mono PERC (~23.4%). Its first TOPCon line arrives only in Feb–Mar 2027.
Policy also cut both ways. In July 2026 the government extended the ALMM List-II deadline for net-metering and open-access projects to December 2026, letting developers keep using imported cells for longer. Peer Vikram Solar's EBITDA margin has already fallen to about 8%, and Premier's is expected near 27%. Websol at 34% is still the highest, which is precisely the risk.
Websol Energy share analysis: how cheap is the valuation?
Very cheap on trailing numbers. At ₹62.36 the stock trades at 8.6x TTM EPS of ₹7.24 and 4.3x book value of ₹14.5. Market cap is about ₹2,700 crore.
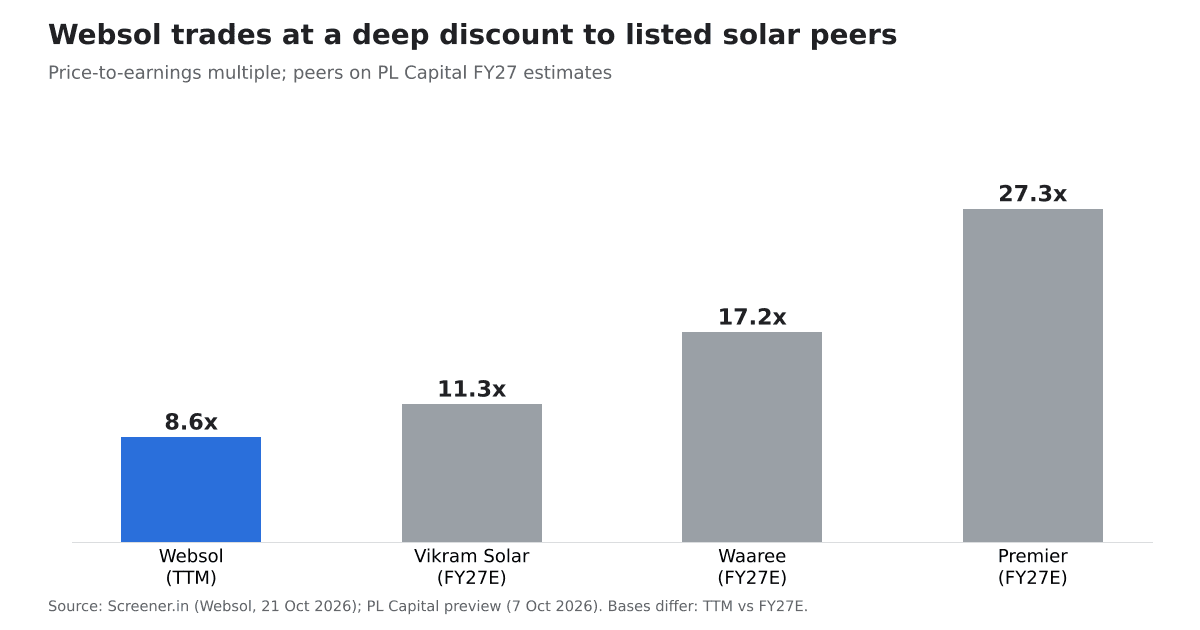
Websol on trailing earnings (21 Oct 2026); peers on PL Capital FY27 estimates (7 Oct 2026). Bases differ.
A single-digit P/E on 67% ROE normally signals one of two things: a mispricing, or a market convinced earnings are at a peak. For Websol it is mostly the second. If EBITDA margin halves toward peer levels, today's "cheap" multiple doubles.
What is the fair value of Websol share? Our scenario model
We value the stock 12 months out on FY28 (Apr 2027–Mar 2028) earnings. The new 4 GW plant contributes little before FY29 in all three cases, so the swing factor is margin. These are our assumptions, not company guidance.
| Case (probability) | FY28 revenue | EBITDA margin | FY28E EPS | P/E | Value per share |
|---|---|---|---|---|---|
| Bear (30%) | ₹1,250 crore | 18% | ₹1.8 | 10x | ₹18 |
| Base (50%) | ₹1,550 crore | 27% | ₹5.3 | 13x | ₹68 |
| Bull (20%) | ₹1,850 crore | 32% | ₹8.0 | 16x | ₹128 |
| Probability-weighted | ~₹65 |
Assumptions: 43.3 crore shares (face value ₹1), 25% tax, depreciation ₹100–110 crore, interest ₹25–30 crore.
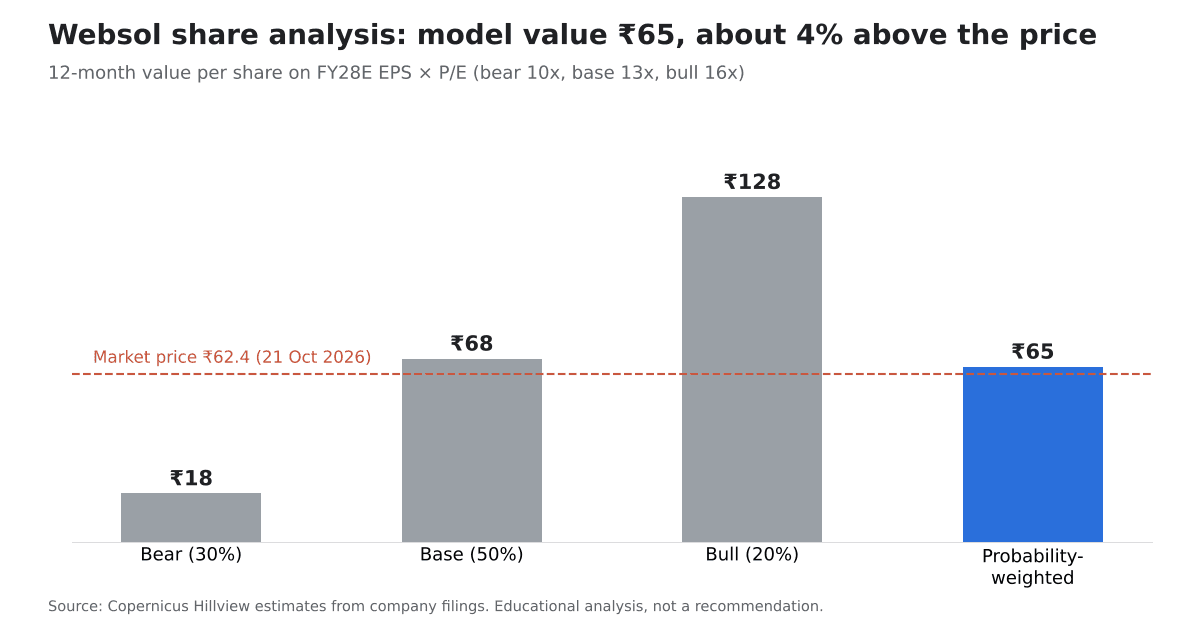
The weighted value of about ₹65 is only ~4% above the price. The base case says the market is roughly right; the bear case (Vikram-style margins) would cut the stock by 70%. In our model, the expected return reaches about 25% only near ₹52, close to the 52-week low of ₹50.40.
The lesson matches our Xtranet Technologies share analysis from the other side: there, a good business was too expensive; here, a cheap multiple sits on earnings that may not last.
What are the key risks for Websol investors?
The biggest risks are margin normalisation, technology obsolescence and the funding of a plant several times larger than the current one. Each could move earnings far more than volume growth can offset.
- Margin normalisation: EBITDA margin has fallen for four straight quarters to 34%; peer Vikram Solar is near 8%.
- PERC obsolescence: all current lines are Mono PERC; TOPCon (750 MW) arrives only by Feb–Mar 2027, and back-contact cells may follow.
- Funding the 4 GW plan: earlier estimates put a 2 GW integrated TOPCon phase at ₹1,600–1,700 crore, implying over ₹3,000 crore for 4 GW, about 5x today's net worth of ~₹630 crore. Management targets 70:30 debt-to-equity with no equity dilution.
- Execution and site change: the project moved from Andhra Pradesh to a 54.2-acre site at Falta in Sep 2026; ground construction only begins in late 2026, so the June 2027 first-phase target looks at risk.
- Input costs: wafers are imported from China, and silver prices have pressured costs.
- Single plant and low promoter holding: all output comes from one SEZ site; promoters own 29.72%.
What should investors watch next?
Four checkpoints will decide which scenario plays out.
- Q2 FY27 results (Jul–Sep 2026): the trading window closed on 28 Sep, so results are due in the coming weeks. Watch whether EBITDA margin holds above 30% and inventory days come down.
- Cell realisations: any slide below the ~14 cents/Wp management cited in Feb 2026 would confirm the bear case.
- TOPCon commissioning (Feb–Mar 2027): on-time start and 24.5% efficiency would protect the cell premium.
- 4 GW financial closure: the debt terms, the equity source, and whether promoters avoid new pledges.
Frequently asked questions
Why is Websol Energy share falling?
Websol has fallen about 55% from its ₹137.90 high because investors expect its solar cell margins to shrink. India's approved cell capacity has grown to about 42.3 GW, module supply far exceeds demand, and Websol's EBITDA margin has dropped from 47% to 34% in a year. Profits are still rising, but more slowly than revenue.
Is Websol Energy a good stock to buy at ₹62?
Our model suggests the stock is roughly fairly priced at ₹62. The probability-weighted value is about ₹65, only 4% higher, while the bear case is ₹18. The low P/E reflects real margin risk. A wider margin of safety would come near ₹52. This is educational analysis, not a recommendation.
What is the target price of Websol Energy share?
We do not issue a target price. Our scenario model gives a 12-month value range of ₹18 (bear) to ₹128 (bull), with a weighted value of about ₹65 on FY28 estimated earnings. The base case of ₹68 assumes ₹1,550 crore revenue and a 27% EBITDA margin in FY28.
Is Websol Energy debt-free?
Almost. Websol prepaid its ₹110 crore IREDA term loan on 4 August 2026 from internal cash, and reported net cash of about ₹34 crore at June 2026. That will change: the planned 4 GW plant is expected to be funded about 70% with debt, likely over ₹2,000 crore.
What does Websol Energy make?
Websol Energy System makes solar cells (1.2 GW) and solar modules (550 MW) at its plant in Falta SEZ, West Bengal. Most output goes to Domestic Content Requirement projects such as PM-KUSUM and PM Surya Ghar, which must use Indian-made cells.
What is ALMM List-II for solar cells?
ALMM List-II is the government's approved list of domestic solar cell makers. Since 1 June 2026, most government-linked solar projects must use cells from listed makers. It protects demand for Indian cells, but listed capacity has grown quickly to about 42.3 GW, which is eroding the scarcity premium.
Conclusion
This Websol Energy share analysis finds a highly profitable, cash-generating cell maker whose best years may already be in the numbers. At 8.6x trailing earnings the stock looks cheap, but four quarters of falling margins, a PERC-only line-up and a large unfunded expansion explain the discount. We would revisit it if margins stabilise above 30% after TOPCon, or nearer ₹52.
Related research: Inox Green Energy share analysis · Xtranet Technologies share analysis
Sources
- Websol Q1 FY27 press release, 10 Aug 2026 (NSE)
- Websol Energy — NSE quote page (NSE: WEBELSOLAR)
- Websol Energy — Screener.in consolidated financials
- Websol FY26 results — TaiyangNews, May 2026
- Q4 FY26 investor call — Saur Energy, 13 May 2026
- Q3 FY26 investor call — Saur Energy, 6 Feb 2026
- West Bengal land allotment for 4 GW plant — 24 Sep 2026
- MNRE ALMM List-II 12th revision — PV Tech, 9 Oct 2026
- PL Capital renewable equipment earnings preview, 7 Oct 2026
- ALMM List-II deadline extension — Trade Brains, 20 Jul 2026
This report is for information only and is not an offer or solicitation to buy or sell any security; views and estimates are as of the date of publication and may change without notice. Investments in securities market are subject to market risks; read all the related documents carefully before investing.